

AI shares fell. The operating evidence moved in a rather different direction.
As the dust from yet another brutal AI sell-off swirls, consider what ASML actually reported on 14 October: record quarterly sales, customers paying for productivity upgrades, and planned supply still falling short of customer demand in 2027 and 2028. Its US shares fell 3.9%.
In the Q&A, ASML explained how it checks that demand: customer purchase orders require substantial downpayments and carry cancellation liabilities beyond those deposits; installation plans are matched against customers’ fab schedules. Interest in 2029–30 deliveries was being discussed, but not yet accepted as orders. Those distinctions are much more informative than the share-price reaction.
At the Open Compute Project summit, the companies building AI infrastructure were explaining how to get more work through the available power, connect larger systems, and bring capacity into production faster. Across the stock market, the infrastructure enabling that work was being marked down violently.
There is a serious investment question in that divergence. It deserves considerably more than “rates”, “financing concerns” or another bubble analogy.
First, what actually happened?
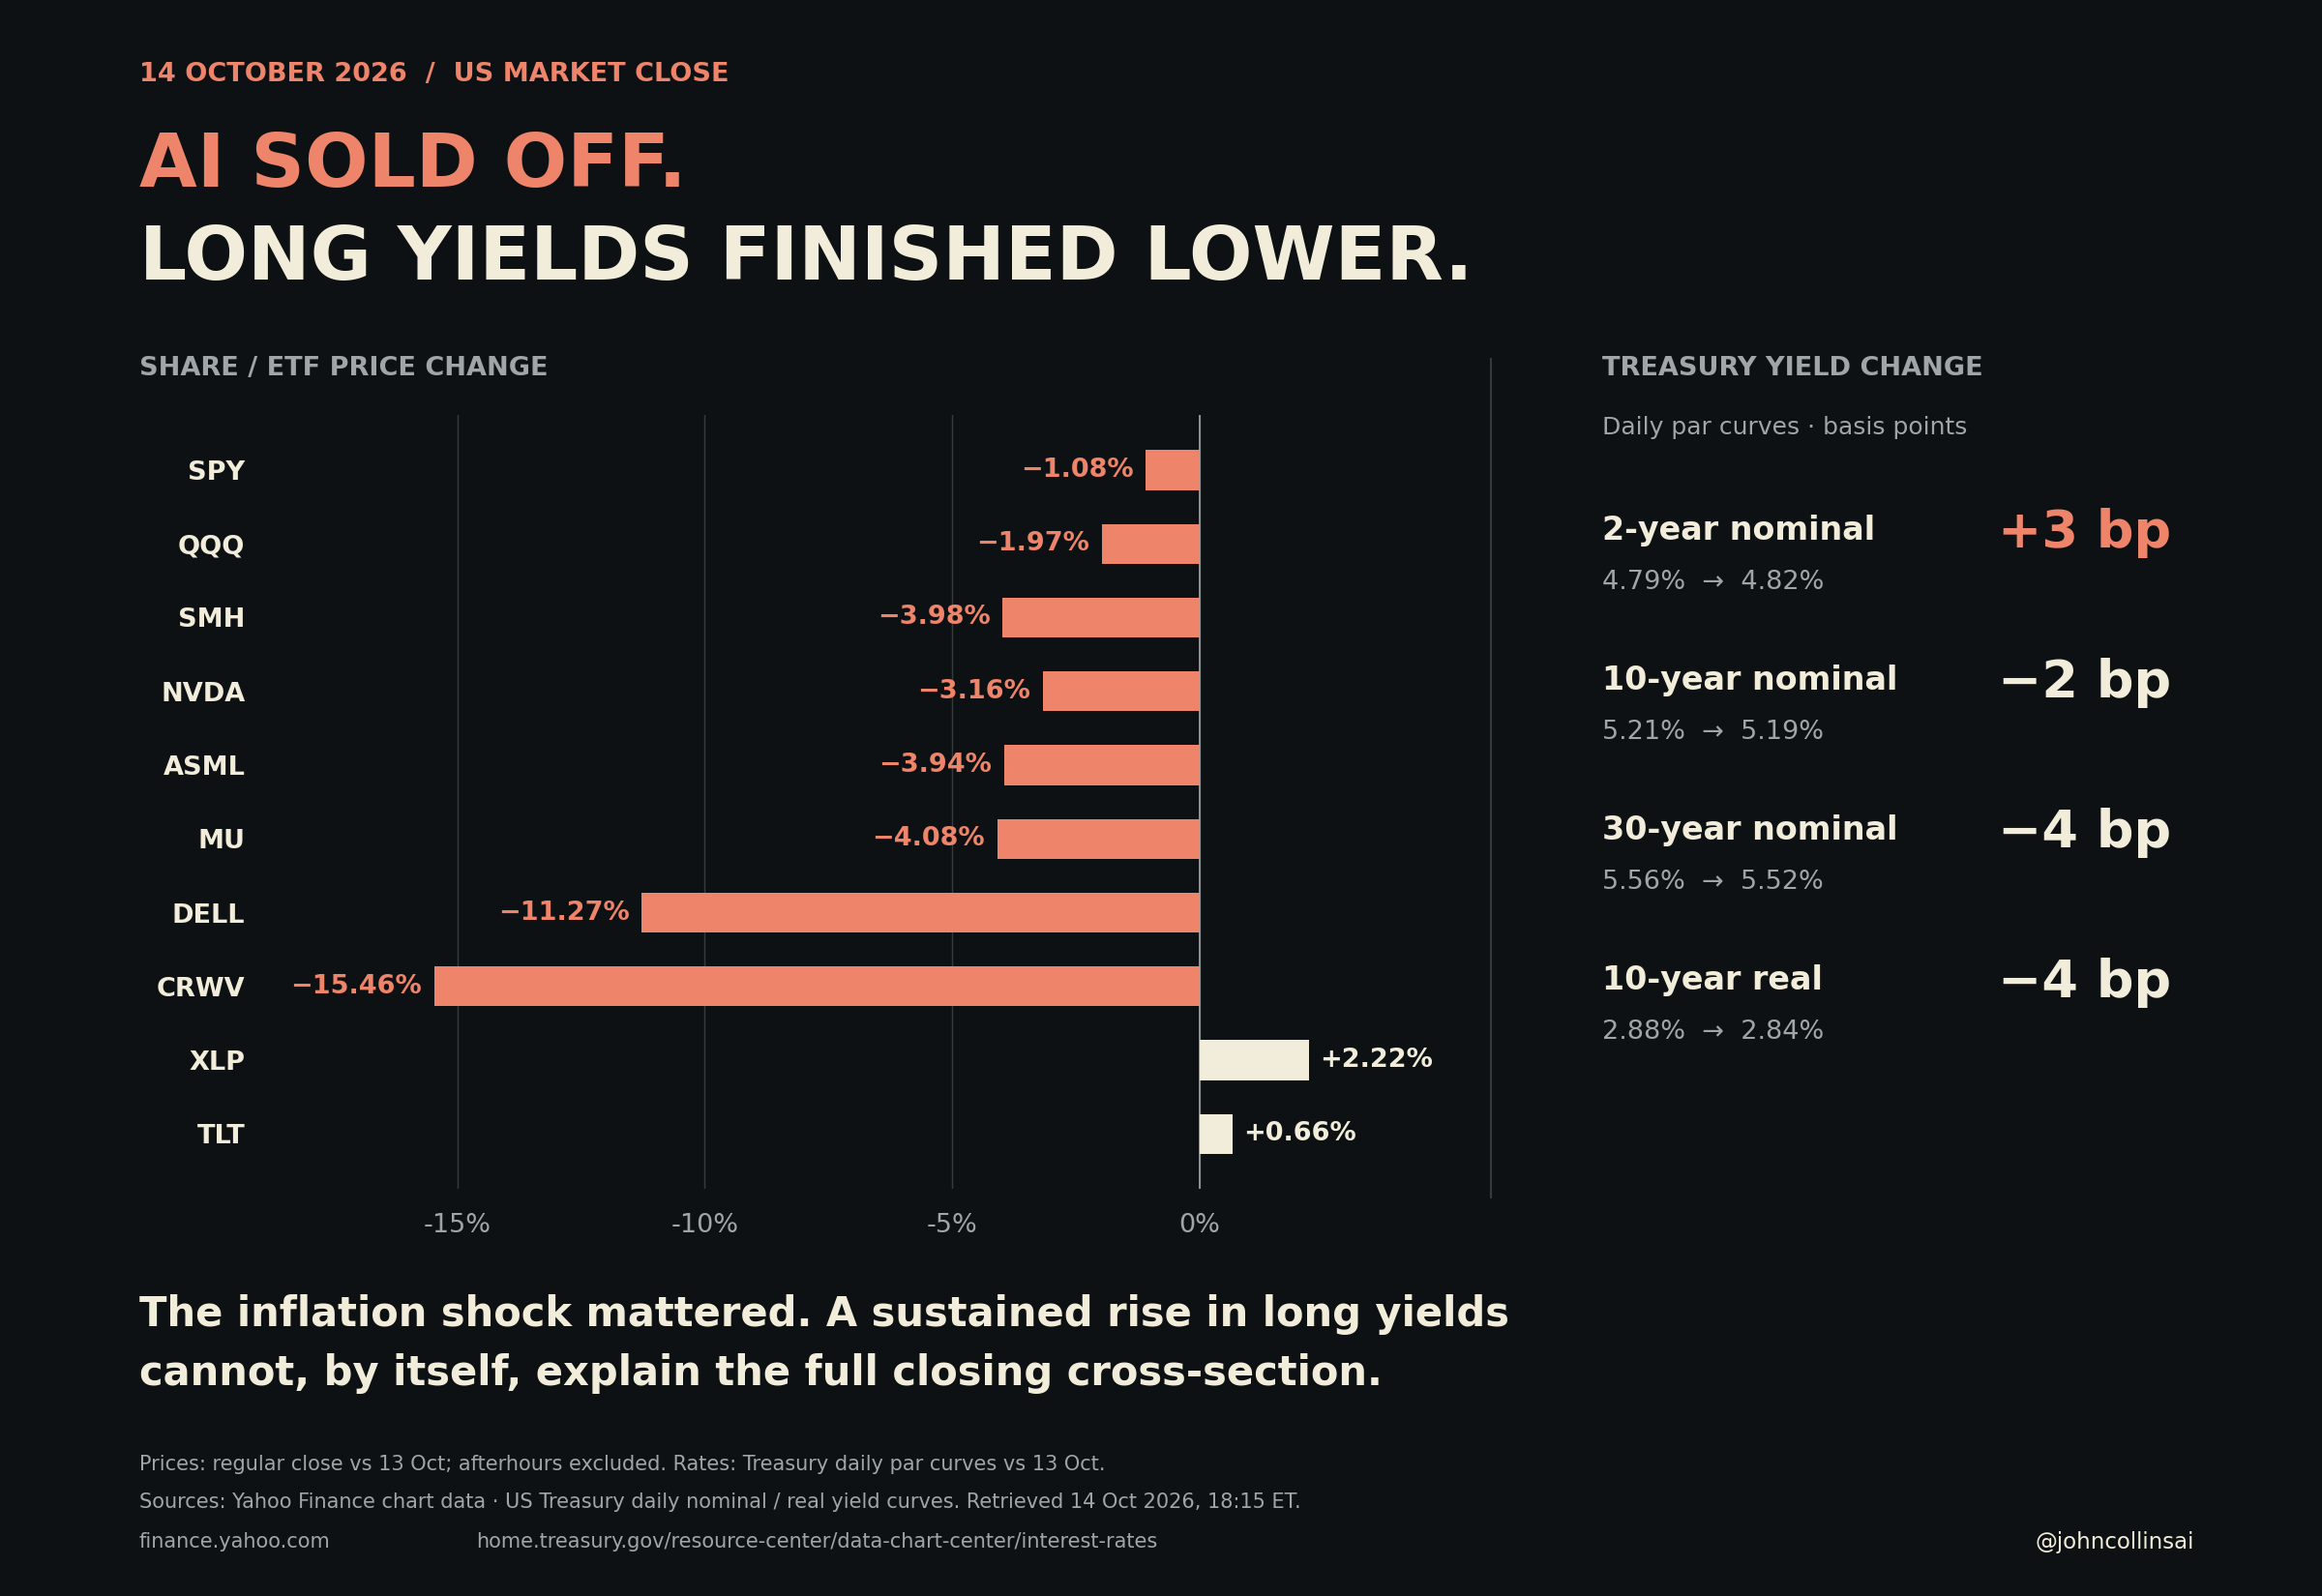
The semiconductor ETF SMH fell 4.0%. Dell lost 11.3%, CoreWeave 15.5%, Nebius 10.1% and Lumentum 9.3%. NVIDIA fell 3.2%. Several of these names continued falling after hours: by the 18:15 ET snapshot, CoreWeave had lost another 3.3% and Micron another 1.4%. The after-hours figures are additional changes from the regular close, not the day’s total loss.
The inflation release was an identifiable trigger. September CPI rose 0.6% month on month and 3.7% year on year. Gasoline accounted for more than half the monthly increase. Equities and Treasuries reacted immediately at 08:30 ET.
But the ten-year Treasury yield finished the day two basis points lower, and the ten-year real yield four basis points lower. The two-year yield remained three basis points higher. The consumer-staples ETF XLP rose 2.2%. Anyone explaining the whole session as a response to a sustained increase in the long-term risk-free rate has a timing problem.
Inflation can alter policy expectations and required returns, but also directly reduces household purchasing power. There is no rule making a gasoline-led CPI surprise more damaging to AI procurement than to consumers. Credit spreads and equity risk premiums can rise while Treasury yields fall; the size and company-specific transmission still need measuring.
There is another complication. In September, Fed Governor Michael Barr identified the surge in AI investment itself as one contributor to inflation pressure. That does not make AI responsible for this gasoline-led CPI release. It does mean that treating interest rates as an external shock while holding the AI cash-flow forecast constant can miss part of the relationship: strong investment demand can help push rates up.
Start with the results and the earnings calls.
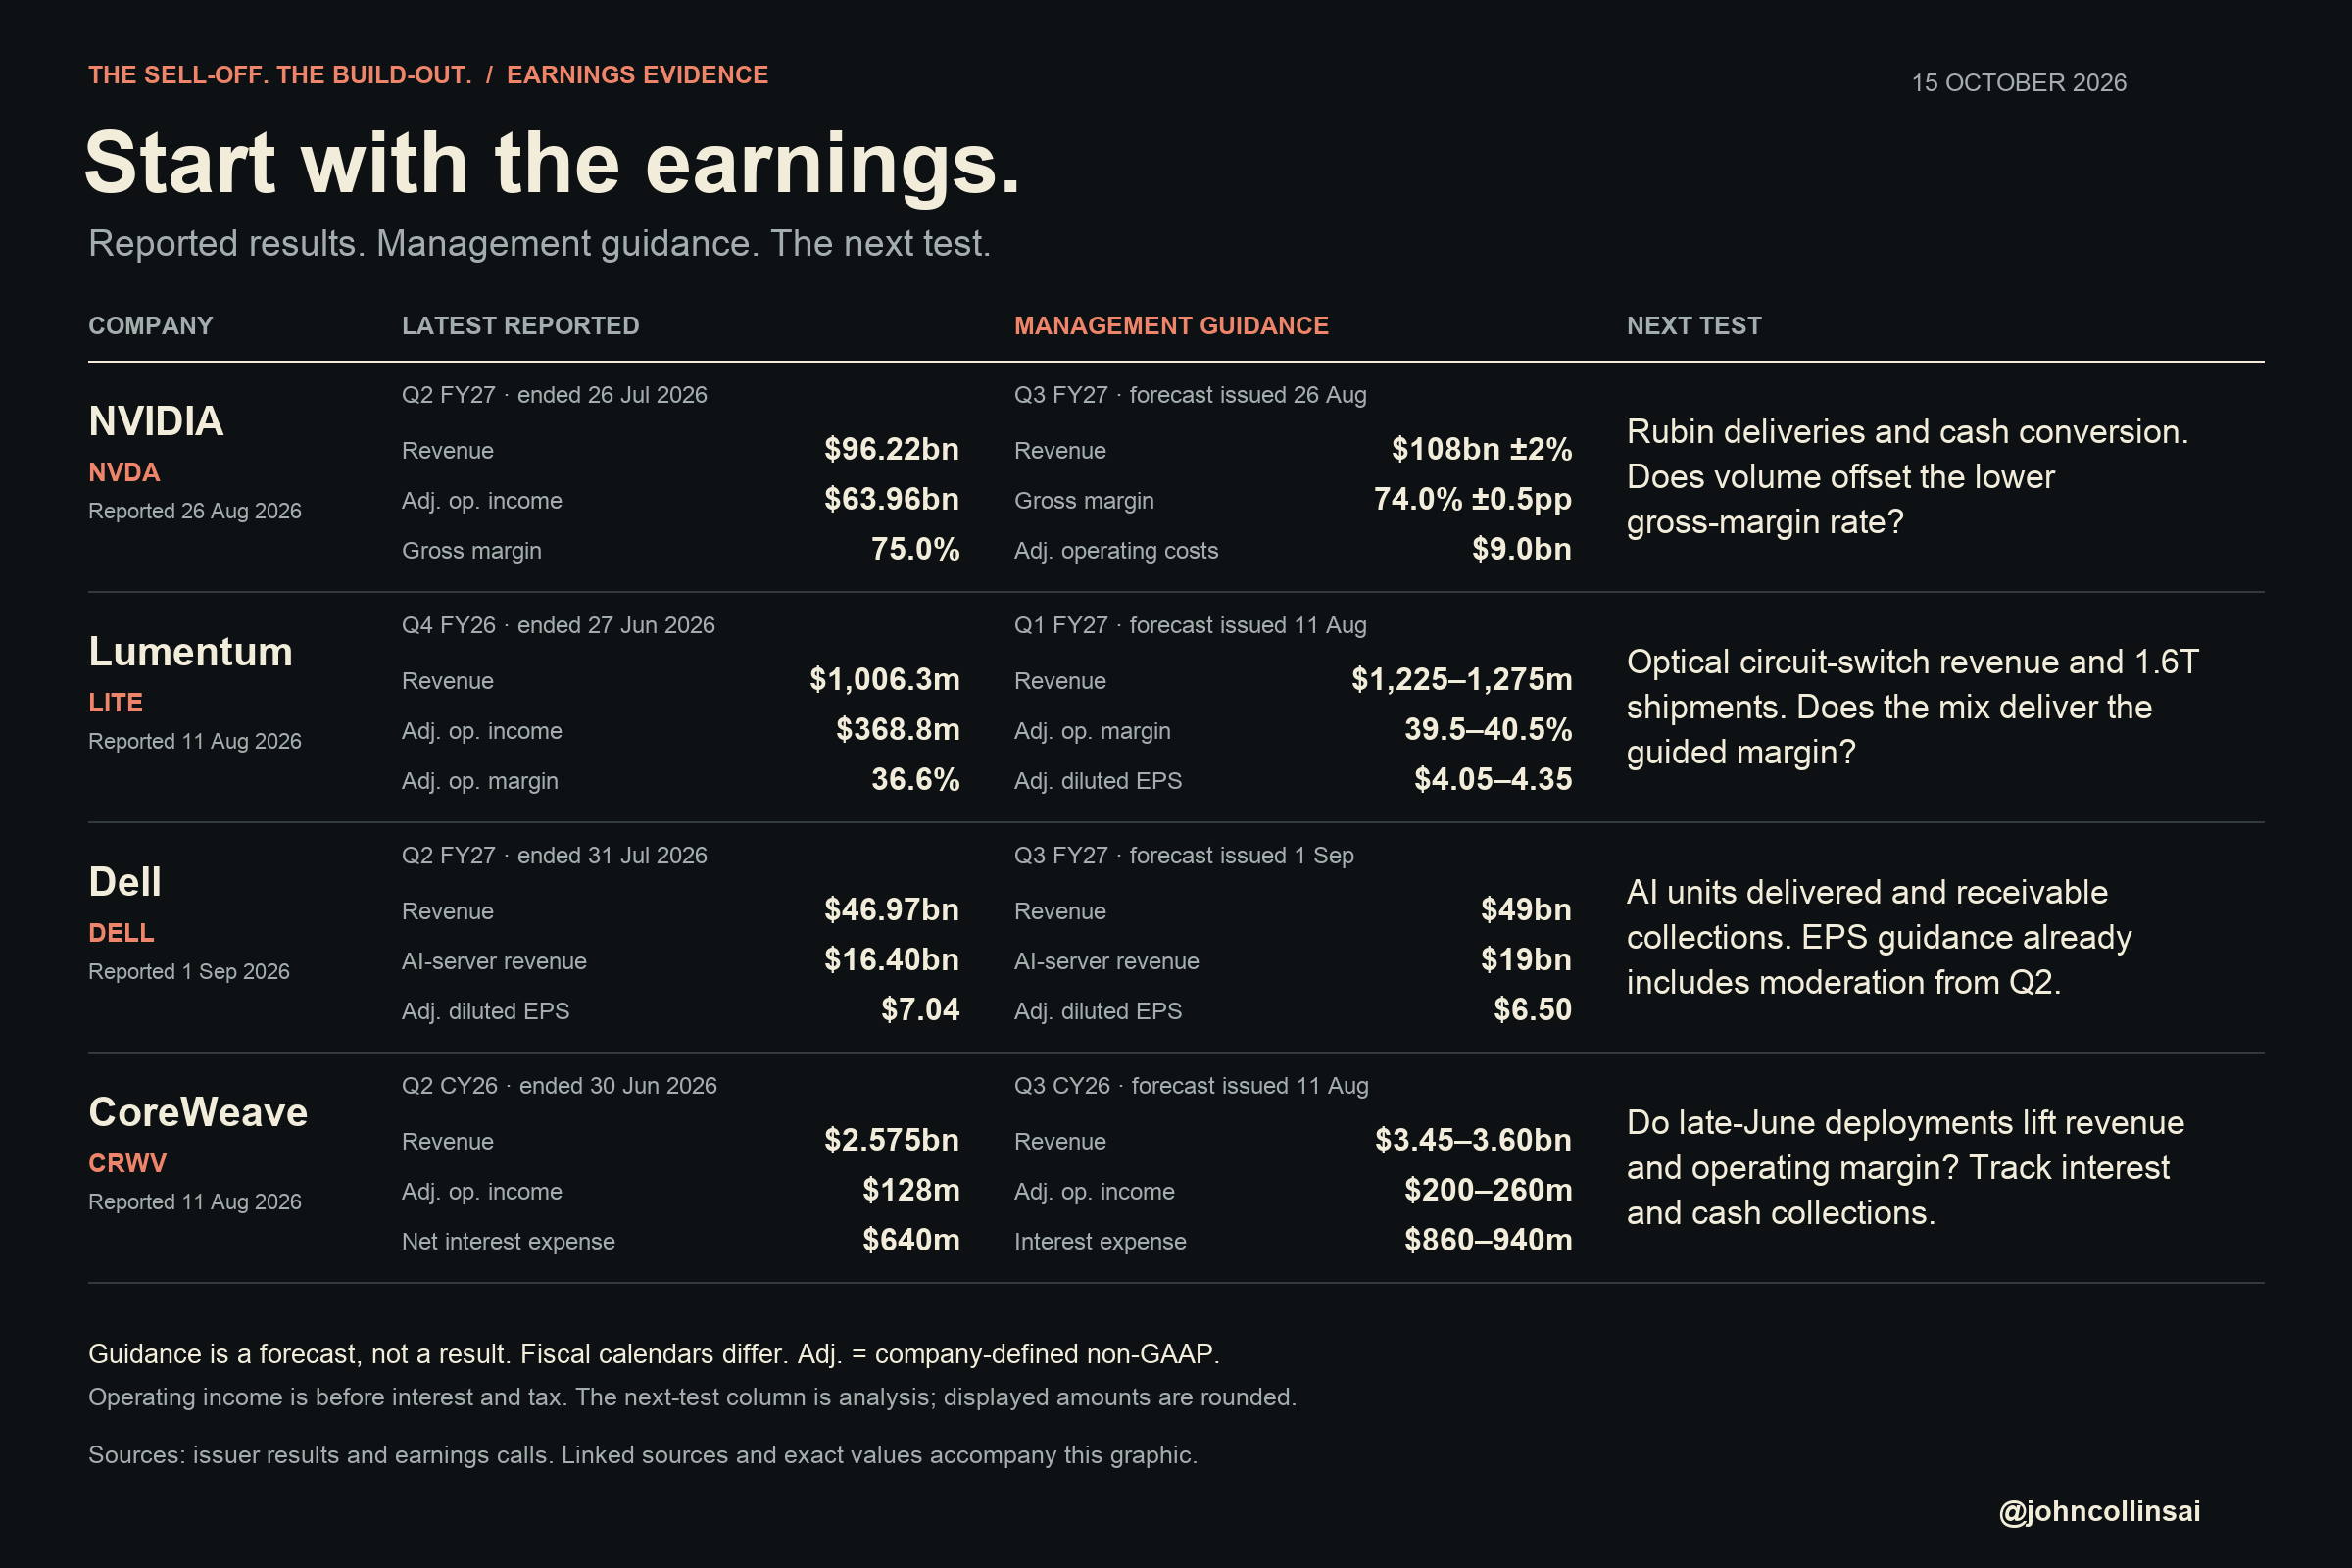
NVIDIA’s latest reported quarter delivered $96.2bn of revenue and $64.0bn of adjusted operating profit. Its August guidance implies roughly $70.9bn of adjusted operating profit in Q3 FY2027, about 11% higher, even as gross margin falls from 75% to 74%. That is calculated from management’s revenue, margin and expense guidance. A lower margin percentage is not the same thing as lower profit.
The call also forecast further margin pressure from rising memory costs. NVIDIA described memory scarcity as part of the same demand surge driving its growth. That matters: a higher input bill for an accelerator supplier can be a revenue gain for a memory supplier. Selling both under the same “AI is in trouble” explanation overlooks the transfer of earnings within the system.
Even the next margin print needs interpretation. Micron’s small guided step down chiefly reflects incentive costs moving through inventory; ASML points to ramp costs. Three companies, different mechanisms. A lower reported margin is not a self-explanatory verdict on AI demand.
Micron’s September call said more than 75% of its FY2027 shipments were already committed. That includes early orders as well as strategic customer agreements; it is not all long-term contracted revenue. Its separate technical Q&A made another useful point: even at the same process node, the manufacturing steps for HBM, advanced host memory and other DRAM increasingly differ. Factory flexibility does not make the products interchangeable.
Lumentum’s latest guidance similarly implies about $500m of adjusted operating profit, against $368.8m just reported. Its call pointed to 1.6T transceivers already shipping and an optical-circuit-switch quarter expected to exceed $100m. These are current products and a specific near-term earnings forecast. The more distant optical scale-up designs discussed at OCP add another horizon; they are not needed to invent this quarter’s growth.
That is relevant to the China headlines too. CXMT’s September announcement established G5 production and a new LPDDR5X product. October reporting described a planned first 4F² DDR5 server module by year-end. Competition is advancing. But that is not a disclosed volume ramp of qualified HBM. Neither source supplies the yield, customer qualification and production quantities needed to turn those developments into an immediate supply forecast for every AI-memory category.
The Dell downgrade is more interesting when read properly.
Public reports of Barclays’ downgrade say Tim Long still models approximately $75bn of Dell AI-server revenue in FY2027 and $100bn in FY2028, with possible upside. That is another $25bn, or 33% growth. The target moved from $603 to $574. Dell closed at $507.93.
The argument concerns valuation, smaller future earnings beats and the contribution of component-price increases to enterprise-hardware revenue. It deserves examination. I have read the accessible reports of the note; I have not obtained the original Barclays model, so I cannot claim its precise EPS revisions or target-multiple bridge.
Dell’s own filing supplies an important distinction. Traditional-server revenue growth was primarily driven by higher selling prices. AI-optimised server revenue growth was primarily driven by units. Extending the pricing argument from one category to the other loses information that the company explicitly discloses.
Its full earnings call goes further. Management linked the $25bn increase in annual revenue guidance to securing constrained components and directing more supply towards infrastructure from a softer PC market. It identified DRAM and NAND, then CPUs, disks, optics, cooling distribution units and power racks among the constraints. Supply-chain execution was already changing the earnings forecast.
The company’s FY2027 AI-server revenue guidance is already $74bn. Barclays’ reported $75bn is barely above it. At the closing price, Dell traded at about 19.9 times its $25.50 company-guided FY2027 adjusted EPS. The reported 21-times-versus-15-times comparison concerns a seven-stock coverage group, not Dell alone. Its usefulness depends on the earnings periods, mix and assumptions being compared.
For the next quarter, Dell guided to $19bn of AI-server revenue, up from $16.4bn, and $6.50 of adjusted EPS, down from $7.04. Some exceptional margin benefits were expected to moderate. A smaller sequential EPS number would therefore not automatically be a new disappointment. It must be compared with the forecast investors actually had.
An analyst can be right that a stock offers less upside after a rally while the business continues expanding rapidly. Equally, “valuation” is not an all-purpose explanation that makes every subsequent price decline correct. The new $574 target stood approximately 13% above the closing price. We still need the earnings and cash-flow bridge.
Enterprise hardware purchases are also an incomplete measure of enterprise AI use. A bank can consume AI through cloud services without buying a GPU rack. Accenture’s October call reported rapidly growing work with emerging AI and data partners alongside largely unchanged general discretionary spending. That is consistent with the bank deployments I examined recently: specific valuable work can expand while the wider technology budget remains disciplined.
OCP changes the investment calculation.
The most interesting engineering example is deceptively simple. NVIDIA showed a selected GB200 workload retaining the same throughput while provisioned rack power fell from 120kW to 90kW. The test used Kimi-K2.5 FP4, Dynamo and TensorRT-LLM, with an 8K/1K workload configuration. GPU power settings fell from 1,200W to 800W.
The arithmetic is 120 divided by 90: a third more identical racks inside the same allocated rack-power envelope. This measures provisioning headroom in that test. It is not a claim that every AI workload uses 25% less electricity.
The economically interesting part is that efficiency can enable MORE equipment to enter service. At an existing site with customers waiting for capacity, recovering a power allocation can make additional racks deployable before another grid connection arrives. Cooling, space, networking and the workload’s service requirements still have to fit. The extra machines must be bought. But the timing of revenue, and the amount of work supported by the site, can change materially.
This is part of a broader set of changes at OCP. Meta explained that demand moves in months while construction takes years, which is why it combines owned campuses, leased facilities and public-cloud capacity. Its flatter network removes a switch tier, reducing hops and infrastructure cost. Microsoft said Maia 200 is already serving Copilot production workloads, with multi-gigawatt deployments of the Maia family beginning in 2027.
These disclosures describe work on the constraints between a customer wanting capacity and being able to use it. They also change where suppliers earn: fewer network tiers per system can coexist with larger systems and more deployments. A company’s share of that spending depends on its actual design positions, not simply its membership of an “AI” basket.
The contractual model determines who receives the improvement first. More output on a fixed-price rented GPU may initially benefit the tenant. Additional billable racks, a lower service cost or a different renewal price can transmit the gain to the operator. OCP supplies mechanisms that can improve returns; the customer and supplier contracts tell us whose returns improve.
ASML’s results provide a commercial counterpart. Installed-base revenue was nearly €400m above guidance, principally because customers bought productivity upgrades. Customers are already paying to extract more output from existing machinery. Separately, Nscale said it deployed 24,000 GPUs in the last month, taking this year’s deployments above 50,000 across six active sites serving production workloads. These are issuer disclosures, with different measurement boundaries, but both concern execution rather than another distant total-addressable-market slide.
We have tested the rate argument before.
I have examined the rate argument before. Over FY2021–25, Microsoft, Alphabet, Amazon and Meta generated about $1.90tn of operating cash against $966bn of cash capex. These are whole-business figures with different fiscal year ends, not a spare cash balance. They show the scale of internally generated funding that the blanket “capital-intensive AI” description leaves out.
The debt detail was equally revealing. IREN’s June balance sheet showed $413m of floating borrowing, with approximately $394m hedged. On that disclosed balance, a full percentage-point rise adds roughly $190,000 of annual interest. It would have been very easy to call IREN “rate-sensitive AI infrastructure” and never do that calculation.
Micron provides a more recent example. Its September results reported $33.2bn of adjusted free cash flow for the quarter, after capex, and another $12.3bn of customer deposits outside that measure. Its year-end debt consisted of fixed-rate notes and finance leases; the floating term loan had been repaid. The customers are bringing capital forward to secure supply. The deposits carry obligations, but they still change who finances the expansion and when.
The scale matters. Micron’s latest filing lists about $2.808bn of fixed-coupon notes. Even the artificial exercise of refinancing all of them at an extra half percentage point adds only about $14m of annual interest: roughly 0.023% of its $62.3bn FY2026 adjusted free cash flow. The existing coupons do not reset. This does not value the shares; it measures the direct borrowing-cost channel that is too often invoked without arithmetic.
None of that disappears because a yield screen turns red. Existing fixed coupons do not reset with Treasury prices. Hedges change the exposed balance. Customer advances reduce the supplier’s immediate funding requirement. Cash can earn more interest. Future financing has to be analysed separately from financing already in place.
Our earlier 239-stock return study, covering 2026 through 23 September, did not establish a robust additional AI rate penalty after broad-market and size controls. It also did not prove immunity. Actual fixed coupons, hedges, customer advances and refinancing dates are a better starting point than assigning every company the same exposure.
CoreWeave’s 15% headline needs a denominator.
The widely circulated near-15% yield refers to secondary trading in CoreWeave’s existing $1.25bn unsecured notes due in July 2032. The coupon is 9.625%. It has not become 15%. The annual contractual coupon remains about $120m; the market value of the bond has changed.
Musk’s widely reported “Yikes” reaction was circulating before the CPI release. One public discussion even interpreted the 15% as the rate CoreWeave had offered to raise new money. That particular interpretation is wrong. It is a documented example of confusion, not a claim about what every seller believed.
That repricing is information about the return buyers demand for that unsecured claim. It can influence the terms of future borrowing. It is not the interest rate suddenly charged on every CoreWeave facility, nor evidence that already-funded racks have ceased to earn.
CoreWeave does have material floating-rate exposure. Its June filing estimated approximately $30m of additional quarterly interest from a one-percentage-point rise, on the then-outstanding floating debt; it separately noted that swaps mitigate some exposure. The portfolio has since changed, so that is a dated sensitivity, not a current whole-company forecast. Contracted project finance, parent-guaranteed facilities, unsecured notes and converts have different terms.
Actual transactions look different. September’s $4.2bn convertible carried a 2.875% coupon, alongside an equity conversion option. A March nonrecourse project facility had a floating tranche at SOFR plus 225bp and a fixed tranche around 5.9%. Other facilities are more expensive and parent-guaranteed. None of these rates can stand in for the whole capital structure.
The earnings call contains a more interesting point. Management said its newer financing structure enabled two- and three-year customer contracts, opening business with enterprises that did not want five-year commitments. Finance was changing which customers could buy, as well as the cost of serving them. That is rather more consequential than a generic label about financing risk.
Meanwhile, CoreWeave’s latest commercial update said new three-to-six-month contracts were being signed at approximately $40m of annualised revenue per megawatt, at higher pricing. That is a selected contract cohort, not a whole-fleet profit figure. But it is direct evidence about what customers are currently willing to pay, and belongs beside the bond-price evidence.
There is a concrete earnings test. CoreWeave’s August guidance put Q3 revenue at $3.45–3.60bn, following $2.575bn in Q2 as late-June capacity came into service. It also guided to $200–260m of adjusted operating profit against $860–940m of interest expense. Growth and the financing burden are both real. The next results need to show how deployment, margins and collections are developing.
The proper questions concern the borrowing that can reset, the cash needed for scheduled amortisation, the terms on which new capacity is funded, and the cash generated by the associated customer contracts. “Company-specific financing concerns” is the beginning of that work. It cannot be its conclusion.
The price can fall while the opportunity improves.
In The bull market had a bear inside it, I showed how the June–July semiconductor drawdown was largely hidden by the broad index. The subsequent recovery matters too. SMH rose 25.7% from its July trough to its October recovery high before the latest decline. Micron recovered 48.5%; Lumentum 88.2%. Those are different peak dates, not a model portfolio return. This has been a succession of violent declines and rallies, not uninterrupted deterioration since June.
Fatigue, leverage, crowded positions and dealer hedging are plausible amplifiers. Price data alone cannot identify them. I will not manufacture a flow explanation because the chart is ugly. What the operating disclosures establish is substantial business expansion and active work to make that expansion more productive.
A discount rate is applied to a cash-flow forecast. Changing the rate while freezing earning power, funding terms and deployment timing is a sensitivity exercise. It is not a complete investment assessment.
OCP is showing ways to bring capacity into service earlier and do more with an installed power envelope. The calls show where those gains can reach shipments, margins and cash, and where costs move between suppliers. Those changes belong in the valuation just as much as the interest rate.
The next earnings reports provide an unusually concrete test: Rubin deliveries, optical shipments, Dell’s component allocation, Micron’s committed supply, and CoreWeave’s conversion of newly energised capacity into receipts. Compare them with the actual guidance and the price now available.
My reading remains constructive on the build-out. The specific opportunity is to find where improving deliveries, productivity or contractual funding are being obscured by a common sell-off. If the contrary case is that those gains cannot earn an adequate return for shareholders, show the financing terms and the per-share arithmetic. That would be worth reading. “AI capex anxiety” is not a substitute.
Data and source note. Price moves use 14 October regular-session closes. The after-hours snapshot was retrieved at approximately 18:15 ET; individual trade times differ. Treasury figures are daily indicative par curves, not simultaneous executable quotes. Public Barclays summaries are attributed as reports; the original model remains unavailable. OCP benchmark claims retain their workload and provisioning boundaries. The September rate study is historical context, not a freshly estimated current beta. See the linked research and source ledger for the complete distinctions.