
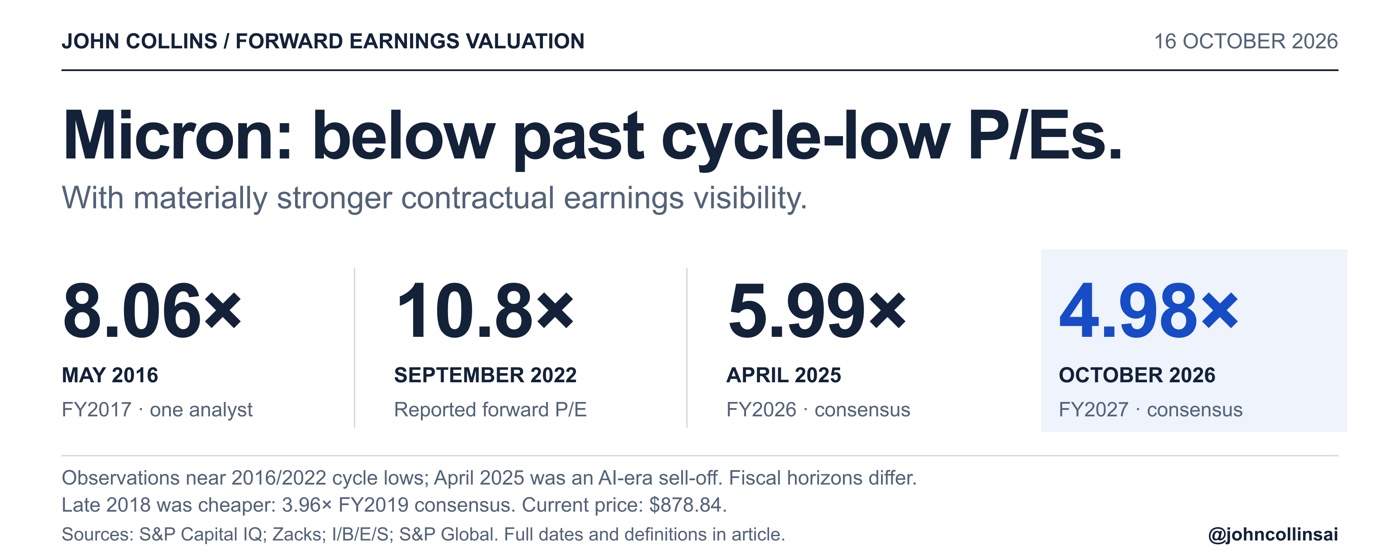
Micron is now cheaper on forward earnings than the published observations around its 2016 and 2022 memory-cycle lows, and the April 2025 sell-off. At Friday's $878.84 close, it stood at 4.98 times FY2027 consensus adjusted earnings.
Yet this is a company with 26 multiyear take-or-pay agreements, covering over 35% of the revenue it expects through 2030. Its CFO expects gross margins at the floors in its price-banded agreements to exceed peak quarterly margins in past memory cycles.
Investors paid more for a dollar of expected earnings around several old lows. Today they are being offered a lower multiple, with years of contracted business behind it. I find that rather extraordinary.
In THERE IS NO MEMORY CYCLE, I set out why the independent PC/phone boom-and-bust template no longer describes memory's role in the AI factory. This article follows that argument into the price being paid for Micron's earnings. [2] [7]
Put today's multiple beside the old lows.
The recovered observations are 8.06× prospective FY2017 earnings near the May 2016 low, a reported 10.8× forward multiple near the September 2022 low, and 5.99× FY2026 consensus at the April 2025 sell-off low. Today's 4.98× is lower than each. [5]
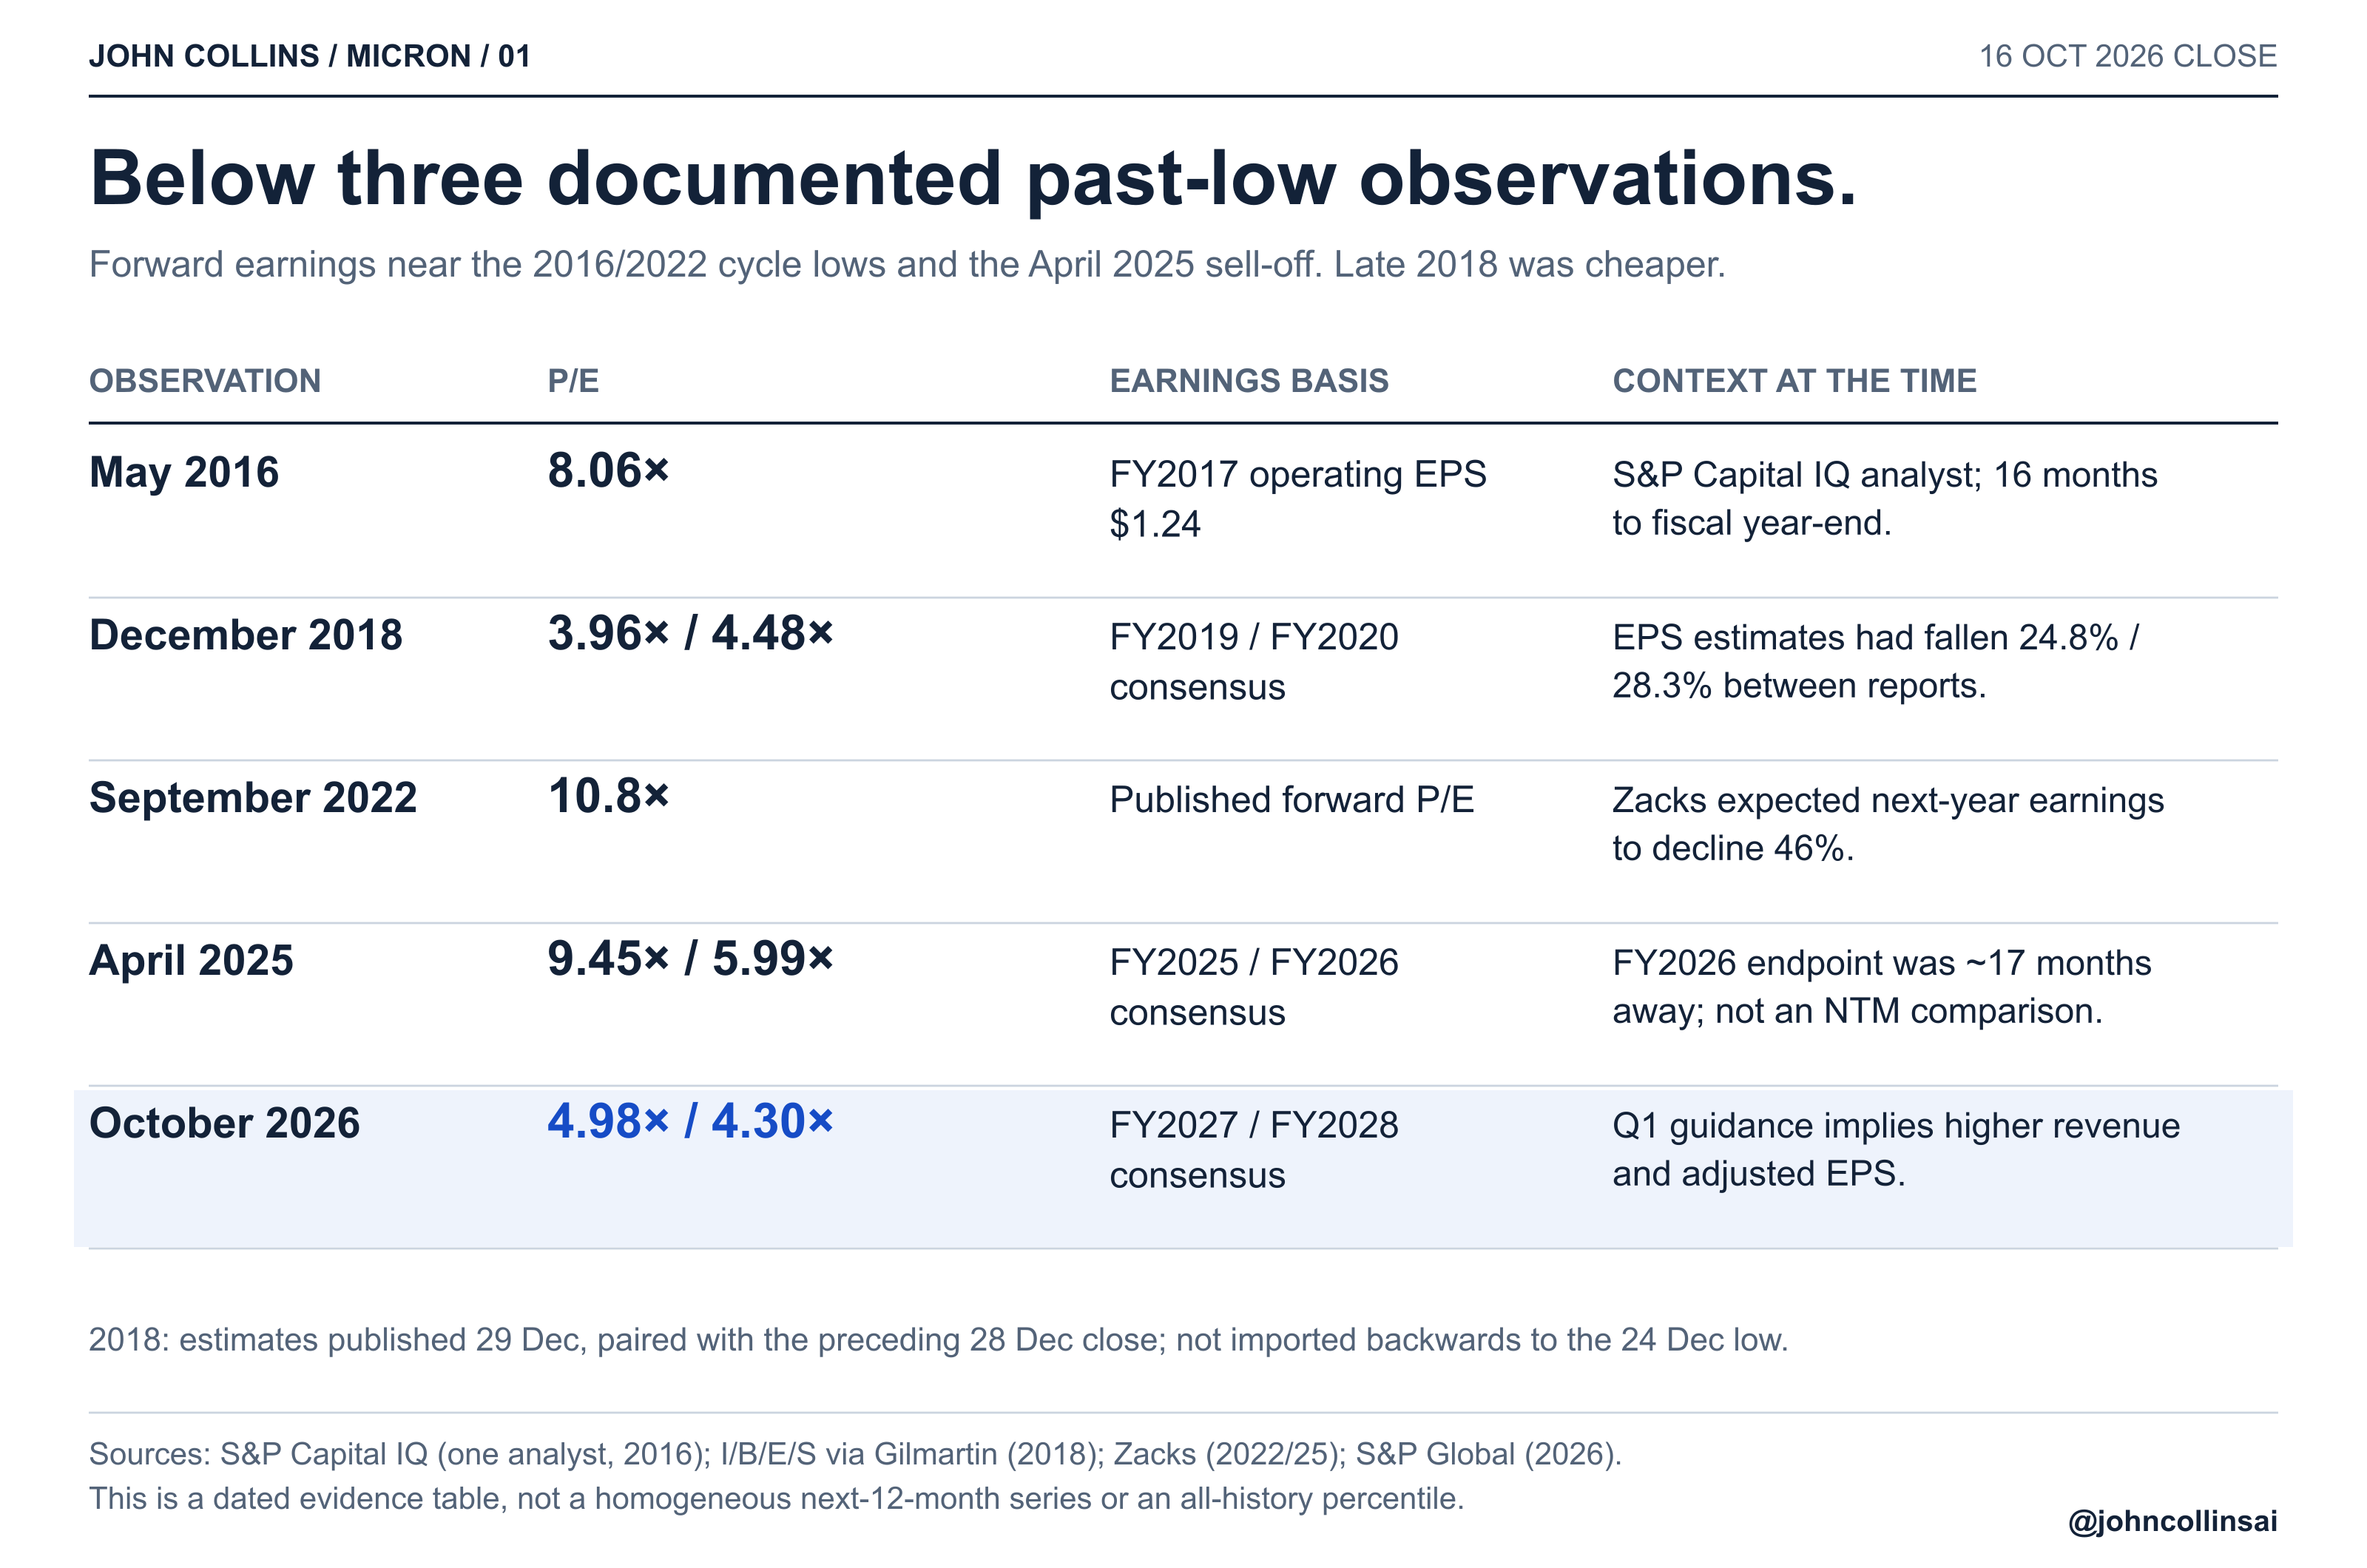
Late 2018 is the important exception: roughly four times forecast earnings, lower than today. The historical estimates also cover different fiscal horizons, and the 2016 observation is one analyst rather than consensus. These are dated comparisons around identifiable lows, not a perfectly matched next-twelve-month series or a complete ranking since 2008.
What those old multiples were buying matters. In late 2018, FY2019 and FY2020 consensus EPS had just been cut by 24.8% and 28.3%. The September 2022 forward view anticipated a 46% decline in next-year earnings. Today, the contracts support a materially different assessment of duration, while the latest guidance points to higher revenue and adjusted EPS. [4] [5] [1]
The significant finding is therefore stronger than “Micron has a low P/E”. Investors paid higher forward multiples around several old lows, when the evidence supporting future profits was weaker. The current price deserves to be assessed against what has changed in the business.
The old cycle discount meets a different contract book.
Micron has 26 multiyear take-or-pay strategic customer agreements. Management estimates that they cover over 35% of revenue through 2030. About three-quarters of that estimated SCA revenue has a defined pricing framework, predominantly floor-and-ceiling bands. That is substantial visibility; it is not 75% of the entire company fixed at today's prices.
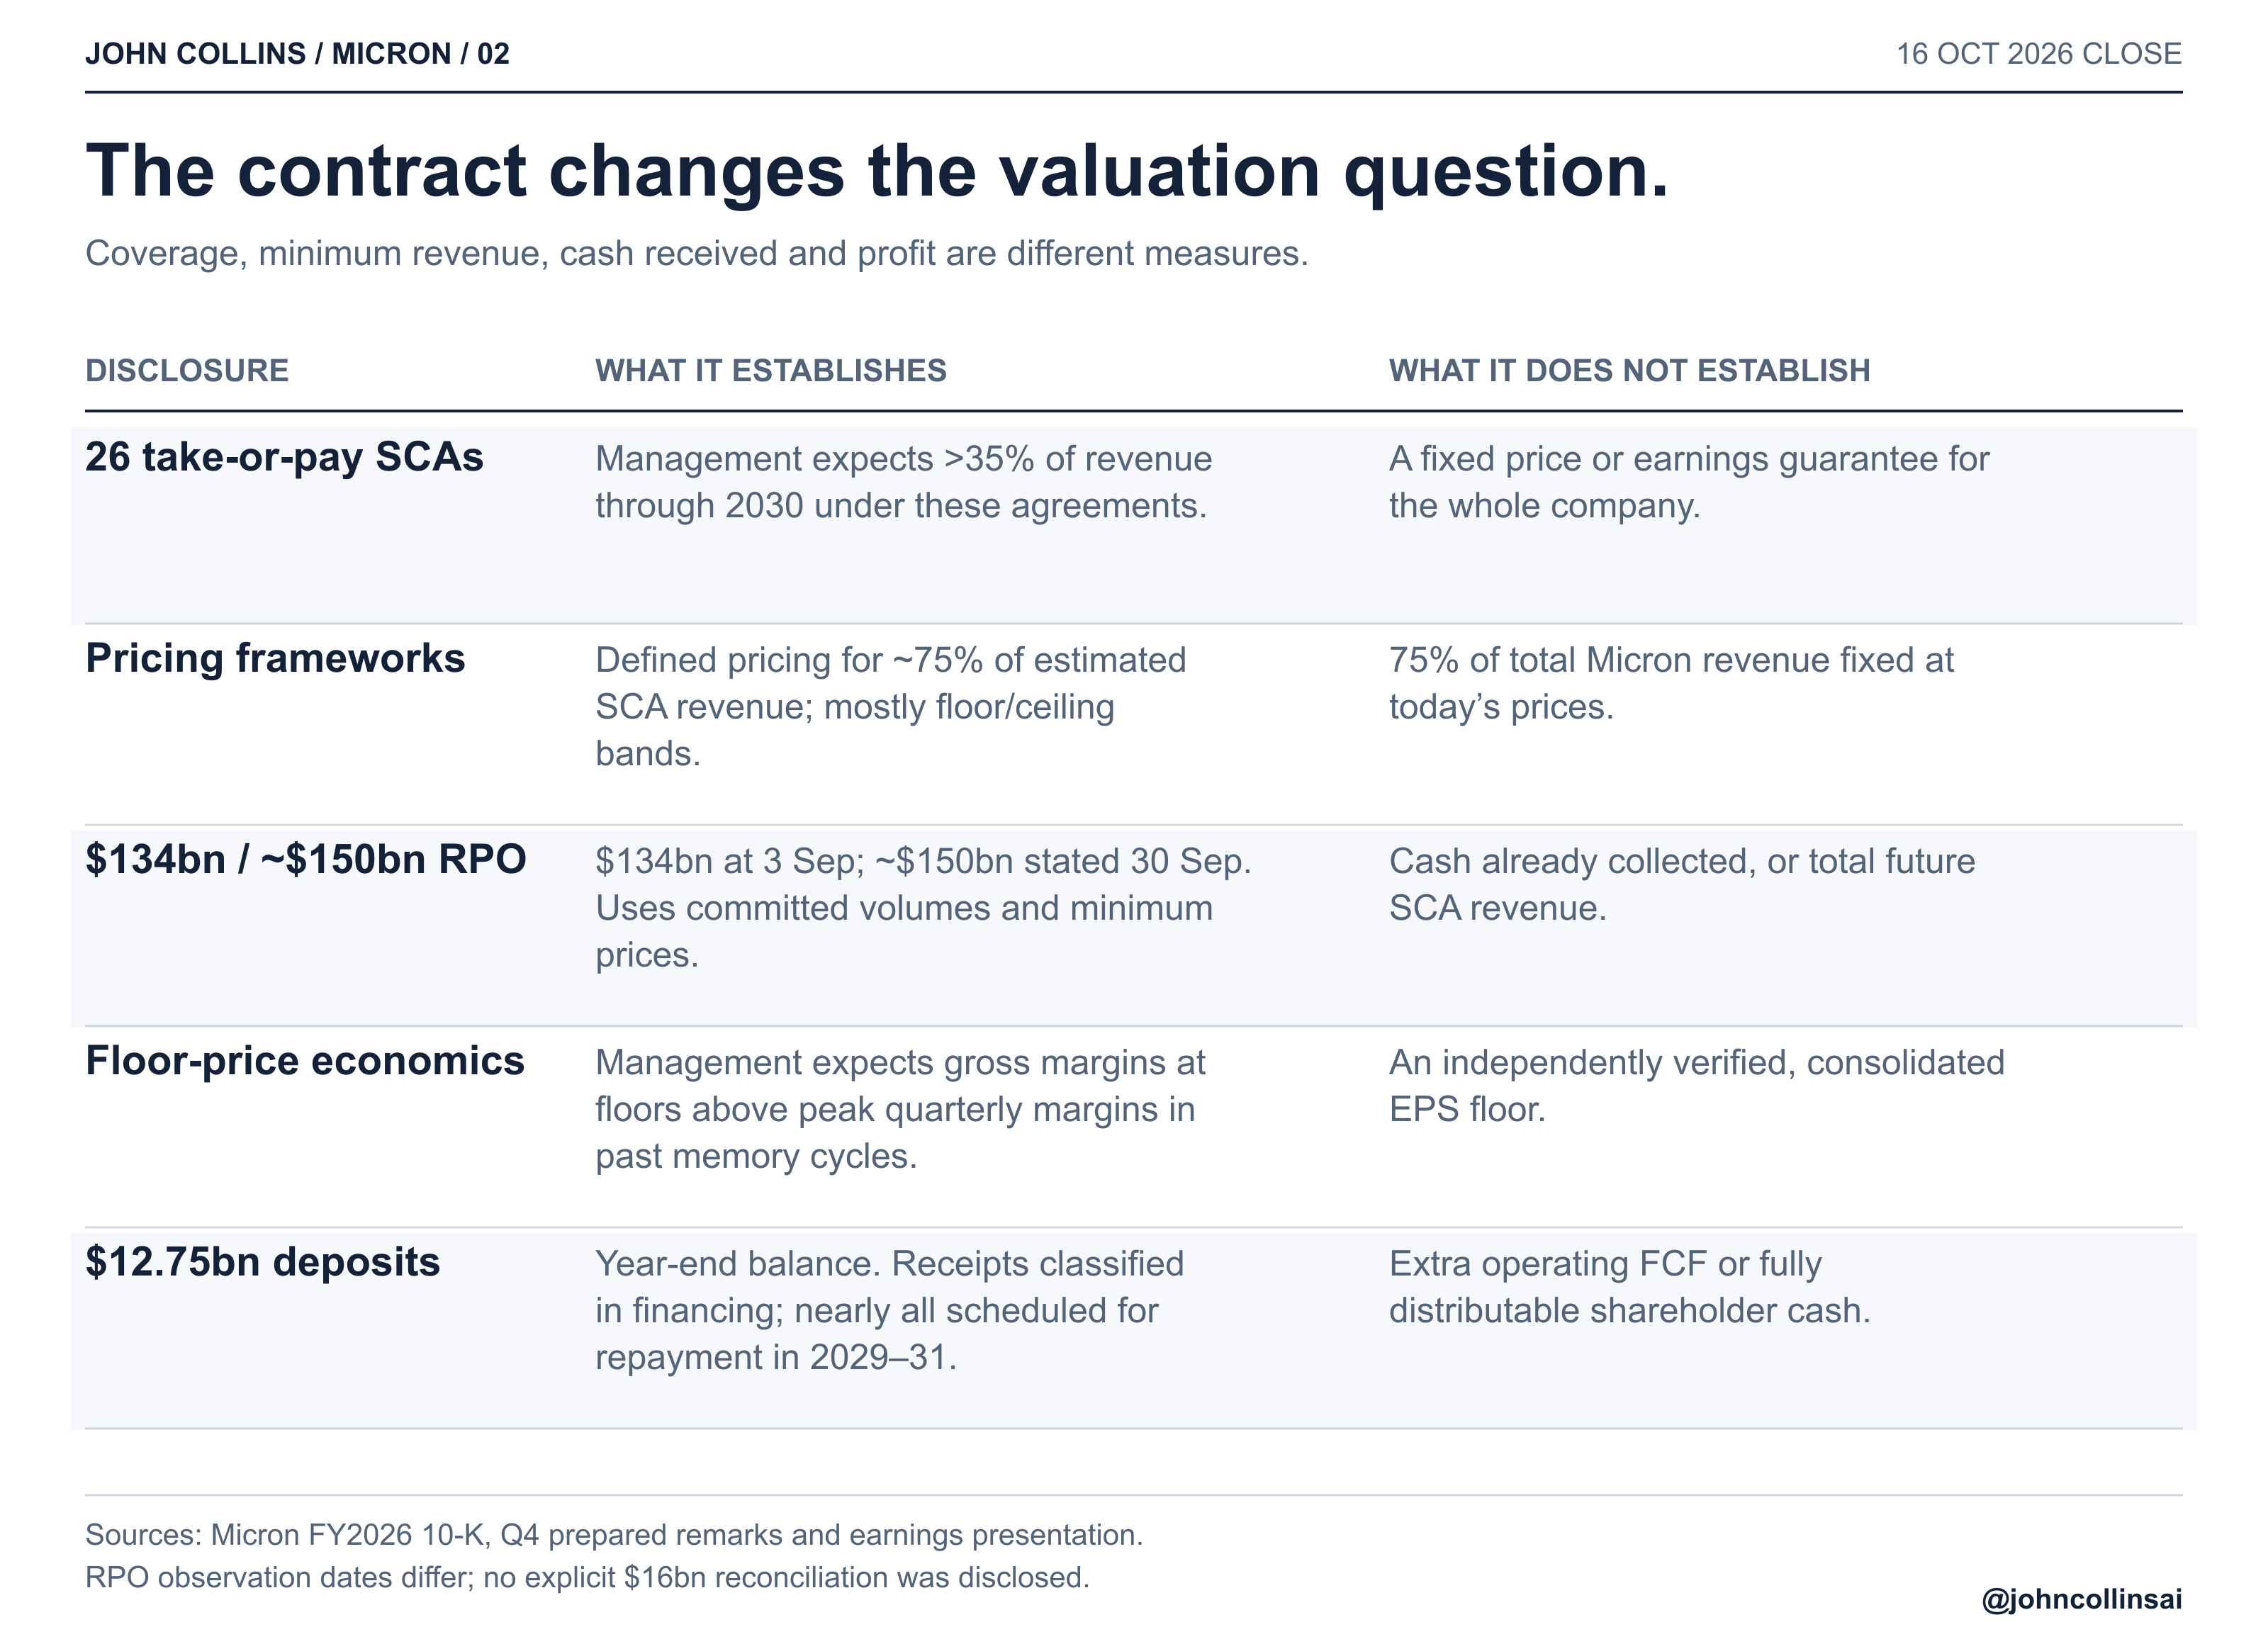
The floor-price margin statement is particularly consequential. It says that the pricing bands can support economics stronger than those associated with peak quarters in past memory cycles. The underlying prices and costs are not public, so that expectation cannot be independently rebuilt into a consolidated minimum EPS. It nevertheless belongs at the centre of the valuation discussion. [7]
Long-term agreements themselves are not new. Micron's 2018 filing described Intel supply agreements priced approximately at cost. The difference lies in what today's contracts cover, the prices they establish and the profits those prices can support. Counting agreements without reading their economics misses the point. [14]
There is a capital-allocation mechanism here too. Committed volumes, pricing frameworks and customer security give Micron better information before equipping new capacity. Management says much of the construction increase brings cleanroom availability in late 2028 and beyond, with equipment deployment paced against demand. The contracts inform both the revenue being earned and the investment required to earn it. [3]
The balance sheet also matters: $73.45bn of cash and investments against $5.18bn of debt. Deduct the $12.75bn refundable deposit balance as well and approximately $55.53bn remains. Calling all of the headline net cash freely distributable would overstate the position. [7]
The current earnings already provide support.
This is not a comparison resting entirely on an ambitious full-year forecast. The current price is 7.08 times the latest reported adjusted earnings pace, and 5.76 times the next quarter’s guided pace. Those are separate calculations, with explicit assumptions.
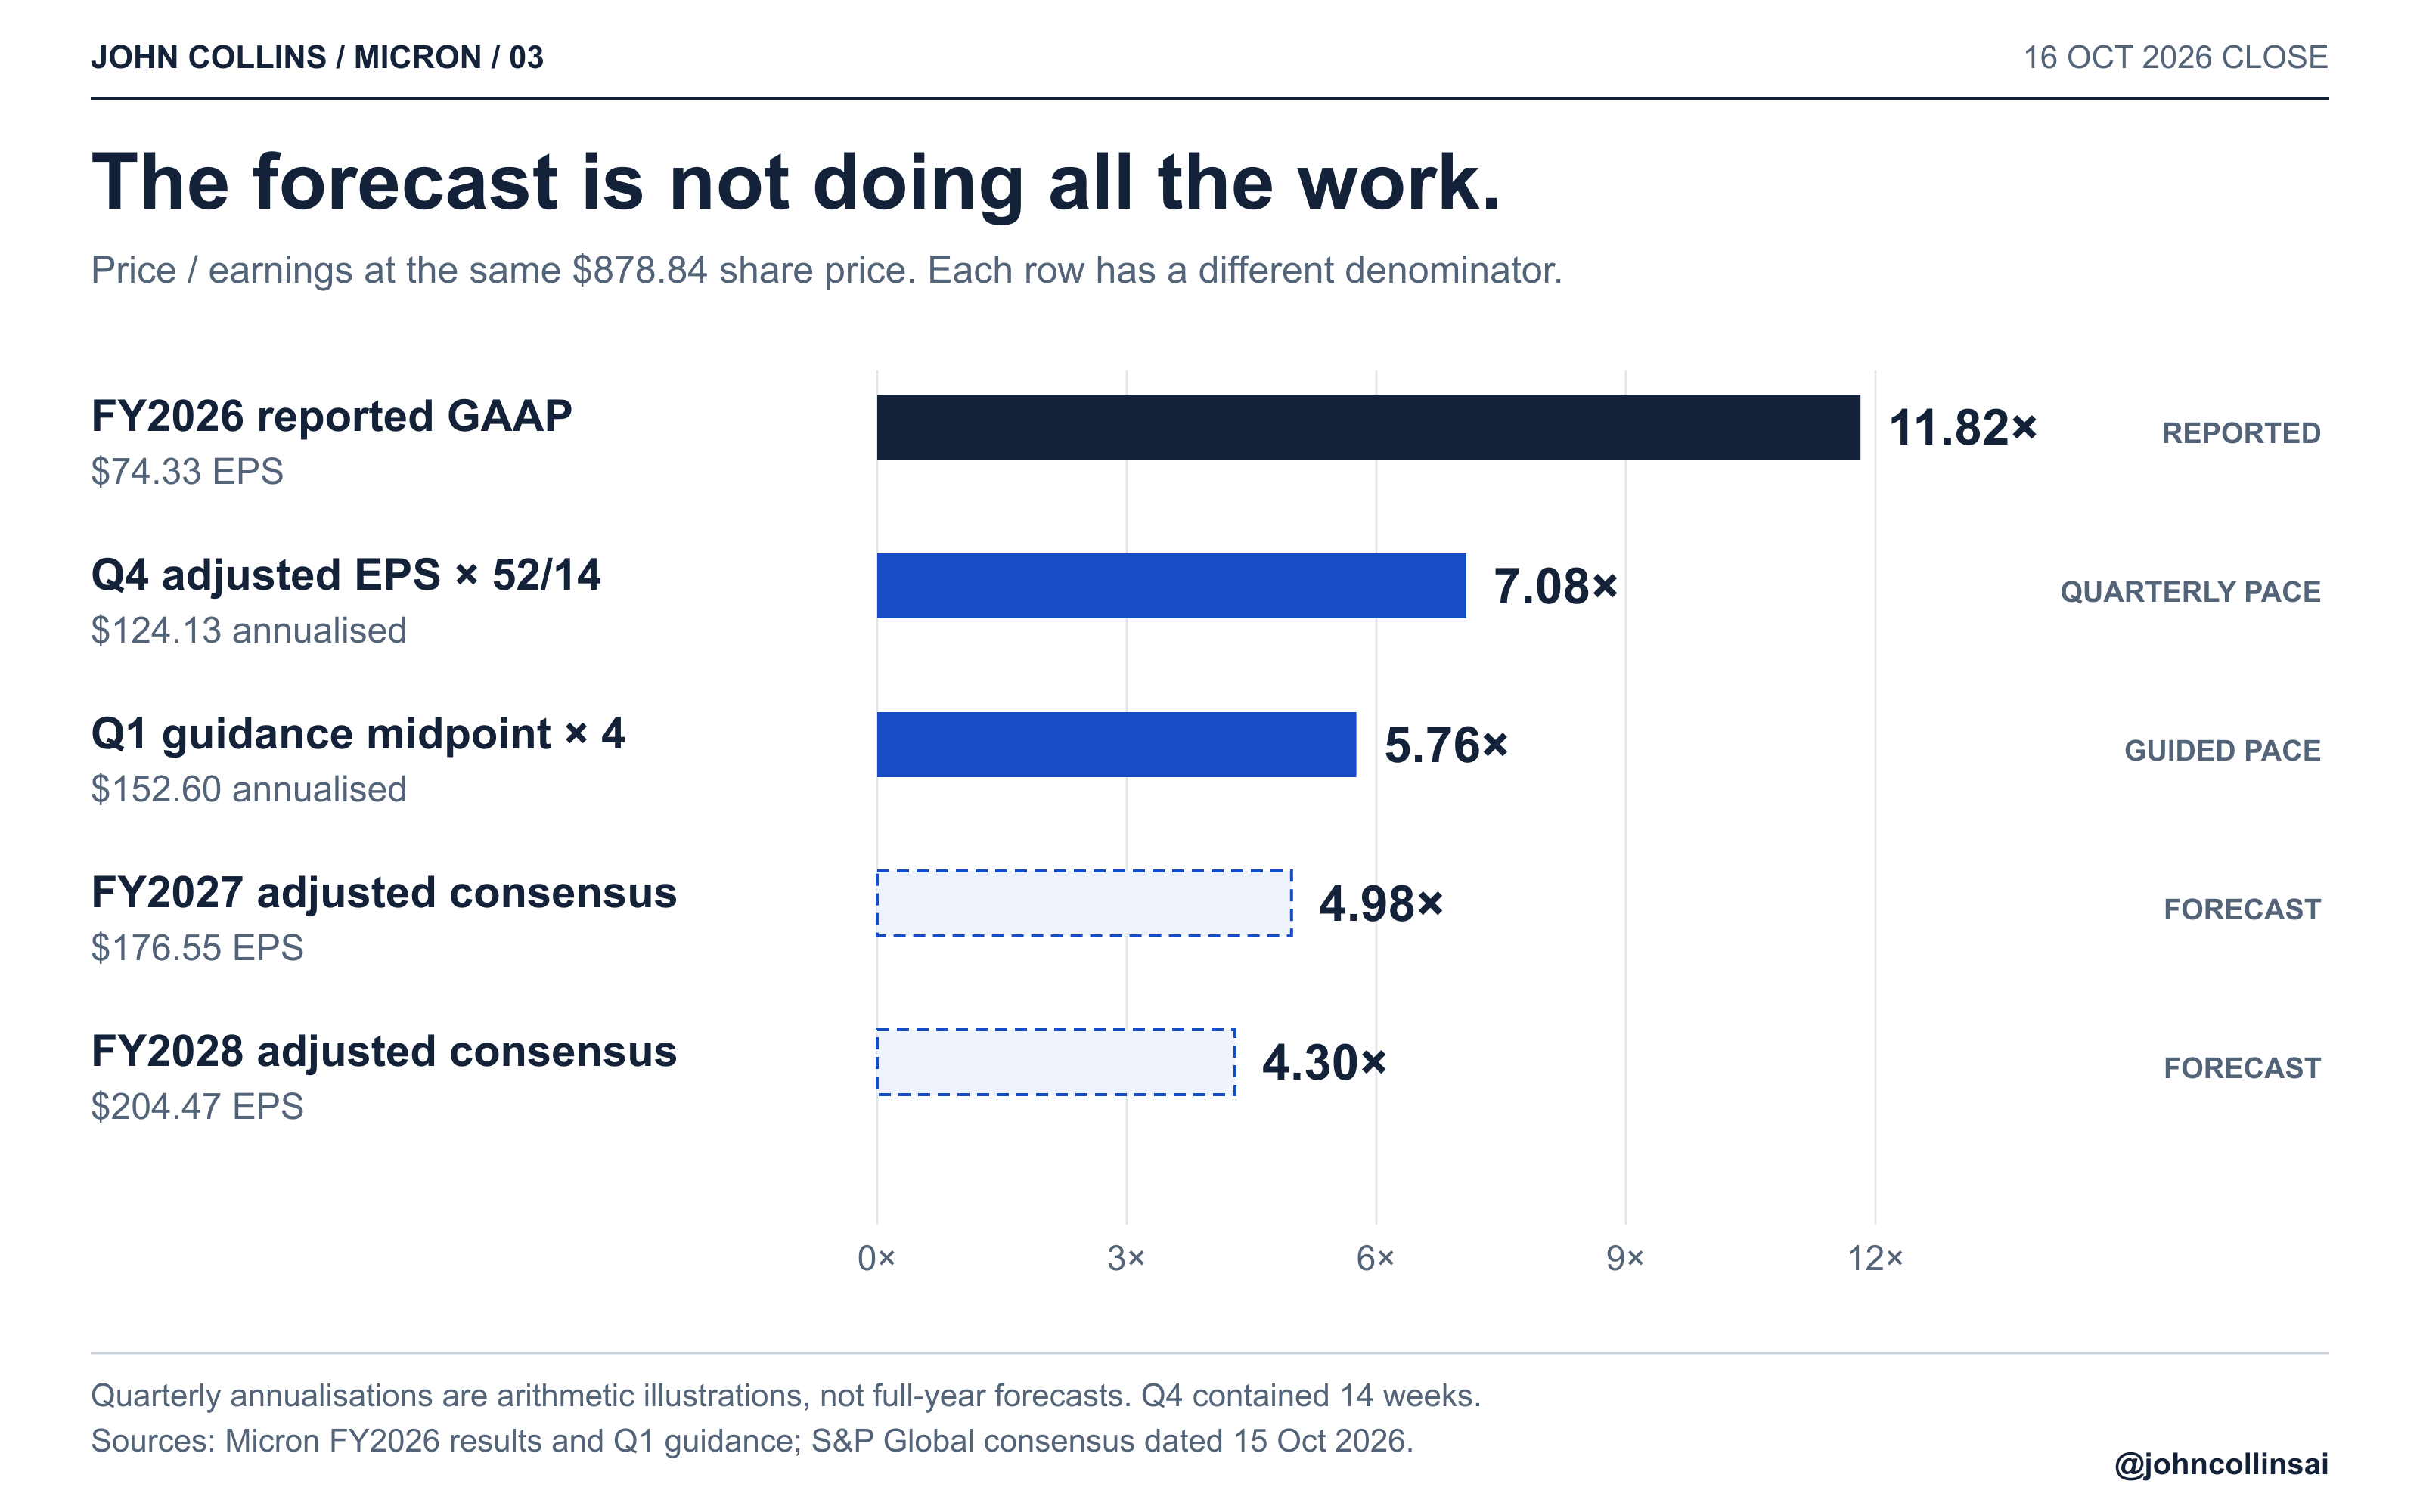
Q4 contained 14 weeks. Annualising its $33.42 adjusted EPS over 52 weeks gives $124.13, and a 7.08× multiple. Multiplying by four would overstate that annual equivalent. The next quarter’s $38.15 guidance midpoint implies a 5.76× multiple if repeated for four quarters. Neither calculation is a full-year forecast. [1] [3]
FY2027 consensus of $176.55 is 15.7% above the guided quarterly earnings pace. If Q1 meets guidance, it requires an average $46.13 per quarter over the remaining three quarters. That is a specific operating hurdle which can be tested against prices, shipments, mix and costs.
The technical change reaches the economics.
The earlier article explains the memory hierarchy. The financial bridge is qualification, product mix and the commercial terms on which capacity is supplied. A wafer-capacity estimate is not an inventory of interchangeable, qualified finished memory: HBM, DDR and low-power products increasingly need different process steps, packaging and customer qualification. [3]
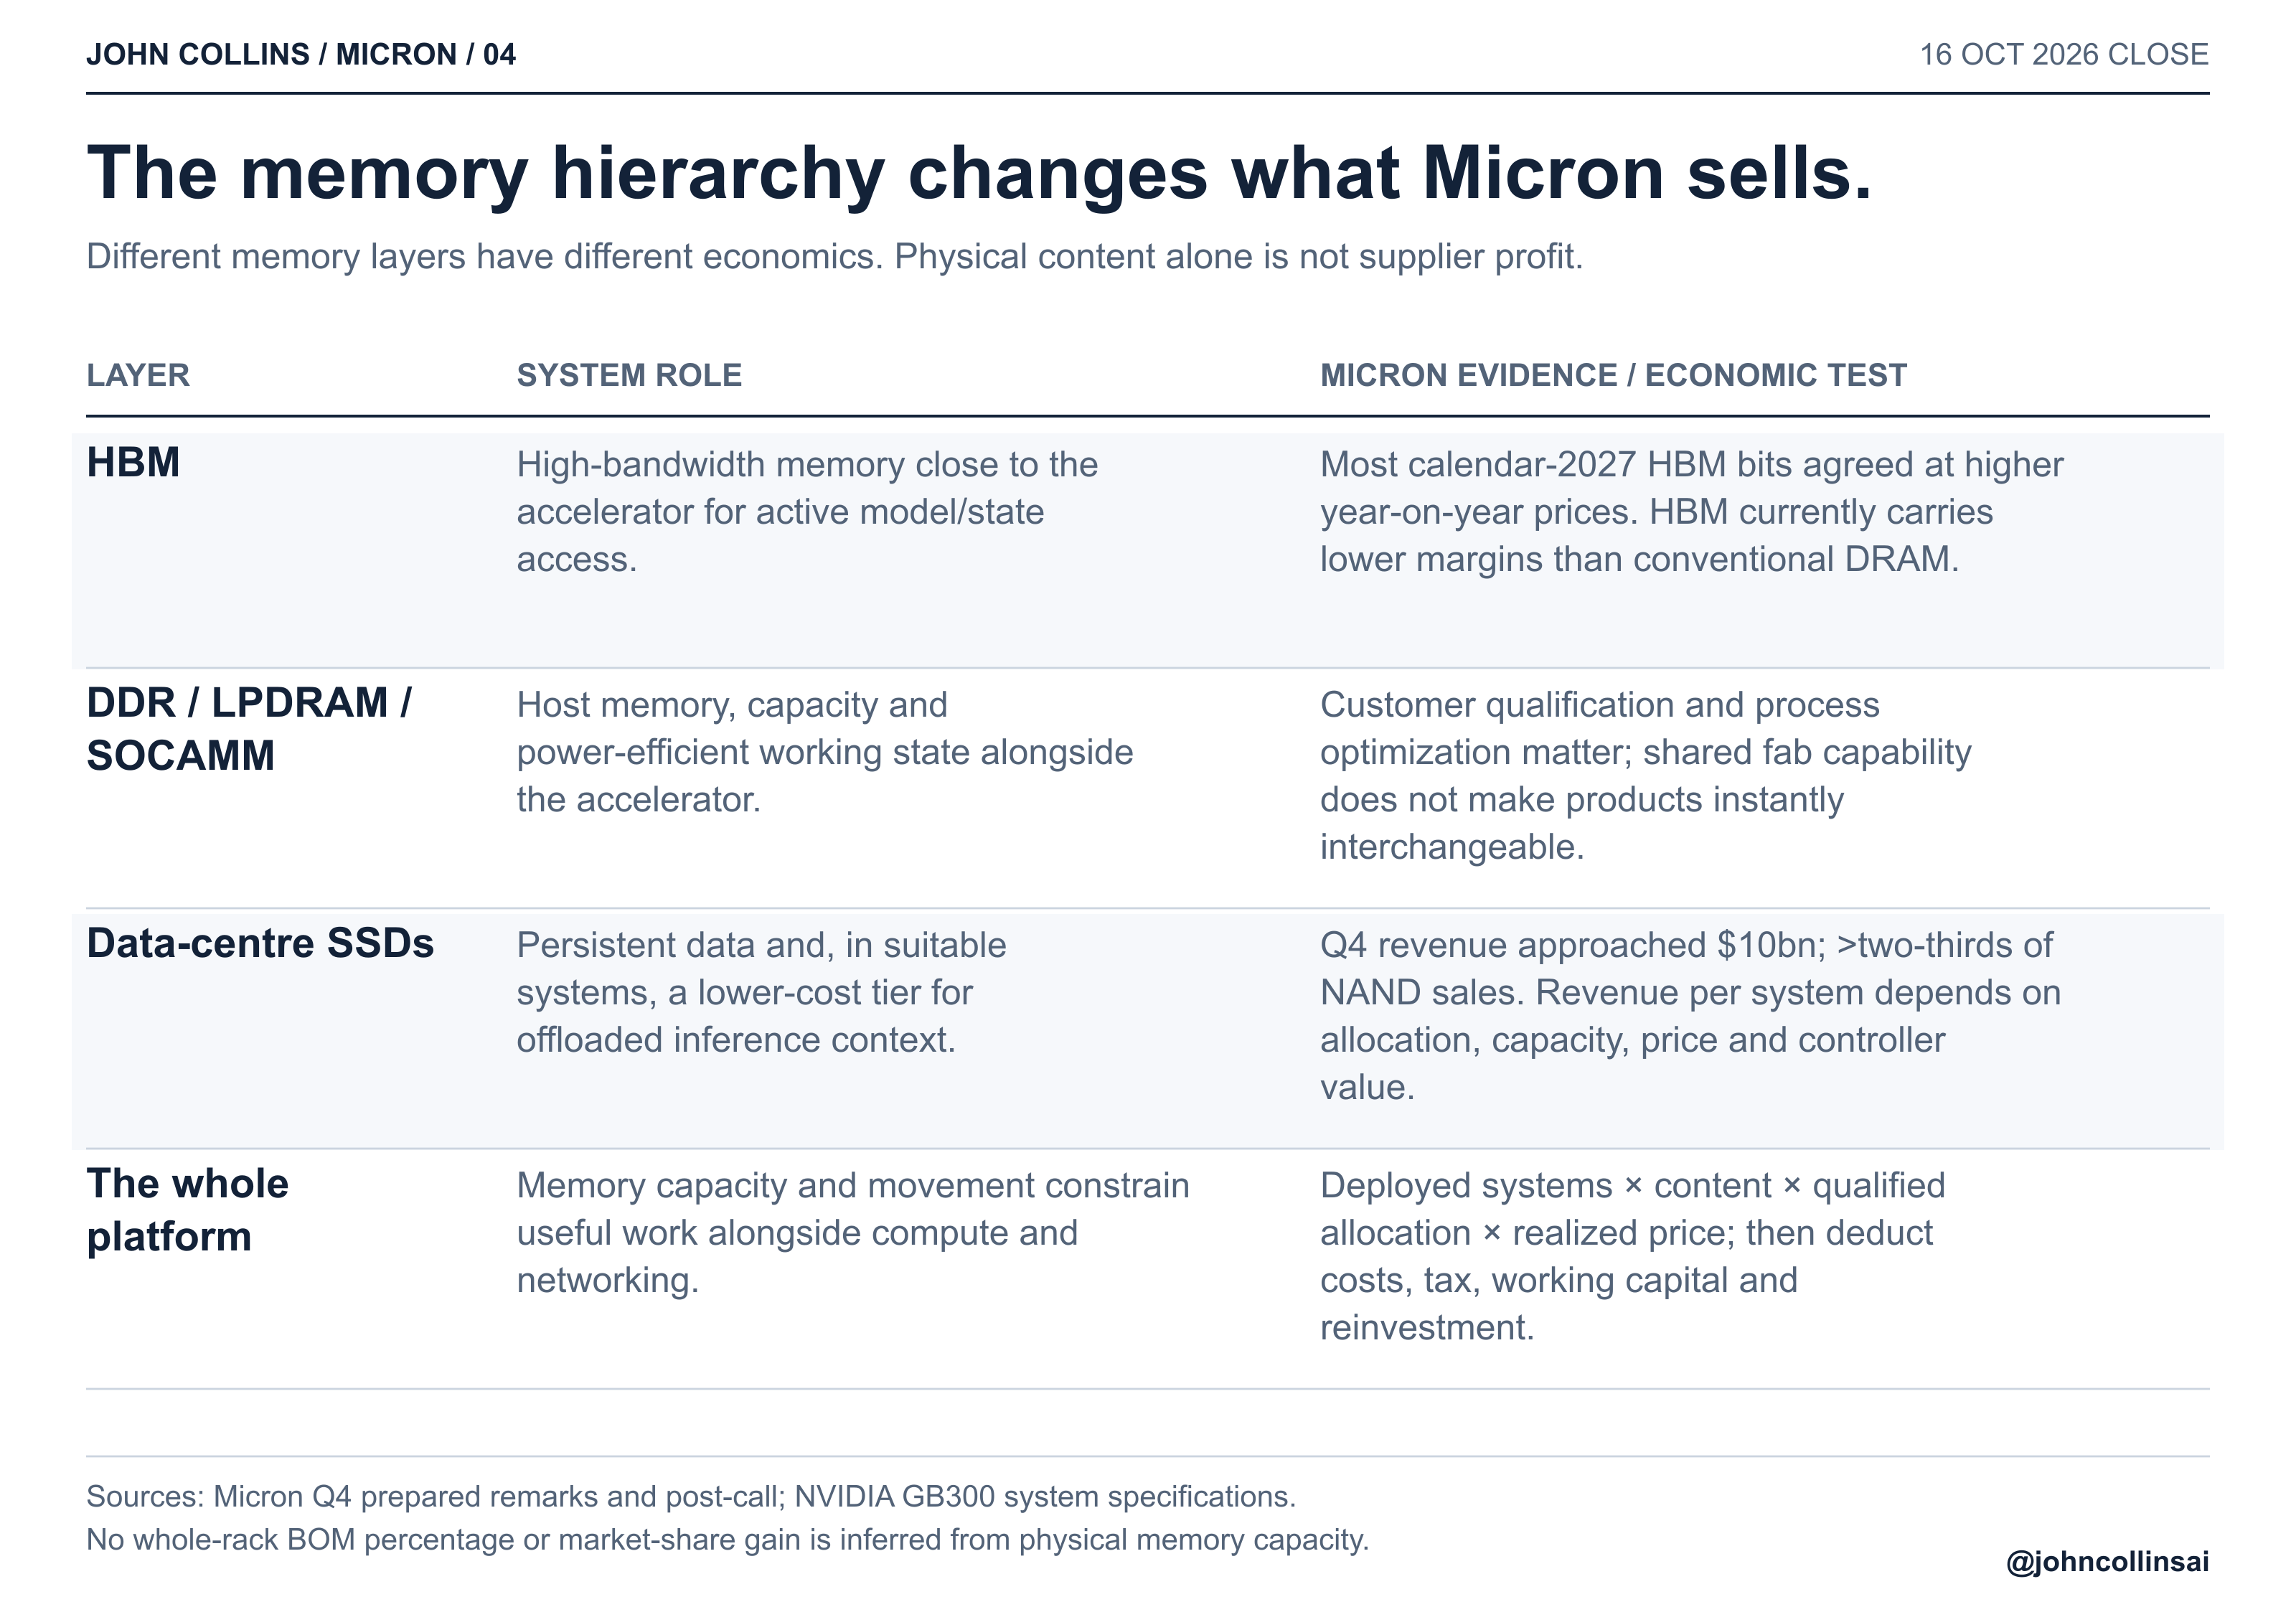
Micron's data-centre business units supplied 60.6% of FY2026 revenue. Q4 data-centre SSD revenue approached $10bn, over two-thirds of NAND sales, and its 7600/9650 SSDs already ship for KV-cache applications. Retaining reusable state outside HBM can avoid recomputation and release fast memory for active work when those savings outweigh transfer costs. That connects a technical system improvement to a product Micron is already selling. [1] [7] [15]
There is no need to invent a universal memory-per-agent multiplier or pretend that every product has the same margin. HBM currently carries lower margins than conventional DRAM. The relevant calculation is deployed systems × content by tier × Micron's qualified allocation × realised price, then costs, tax, working capital and reinvestment to reach cash per diluted share. [9]
Now look at the cash being generated.
In Q4, operating cash flow of $43.973bn less $11.110bn of gross cash capital spending left $32.863bn. Customer deposits did not manufacture that result: they were classified as financing cash flows, outside operating cash. [1]
Normalise the 14-week quarter to 52 weeks and the cash equivalent is $122.06bn, or approximately $107.88 per current share. Friday's equity value was 8.15 times that pace.
That adjusts the calendar, not the quality of every cash-flow component. Working-capital and tax-payment timing remain in the number. Non-current income taxes payable rose from $0.65bn to $9.82bn over the year; their payment schedule matters before treating quarterly cash as recurring. [7]
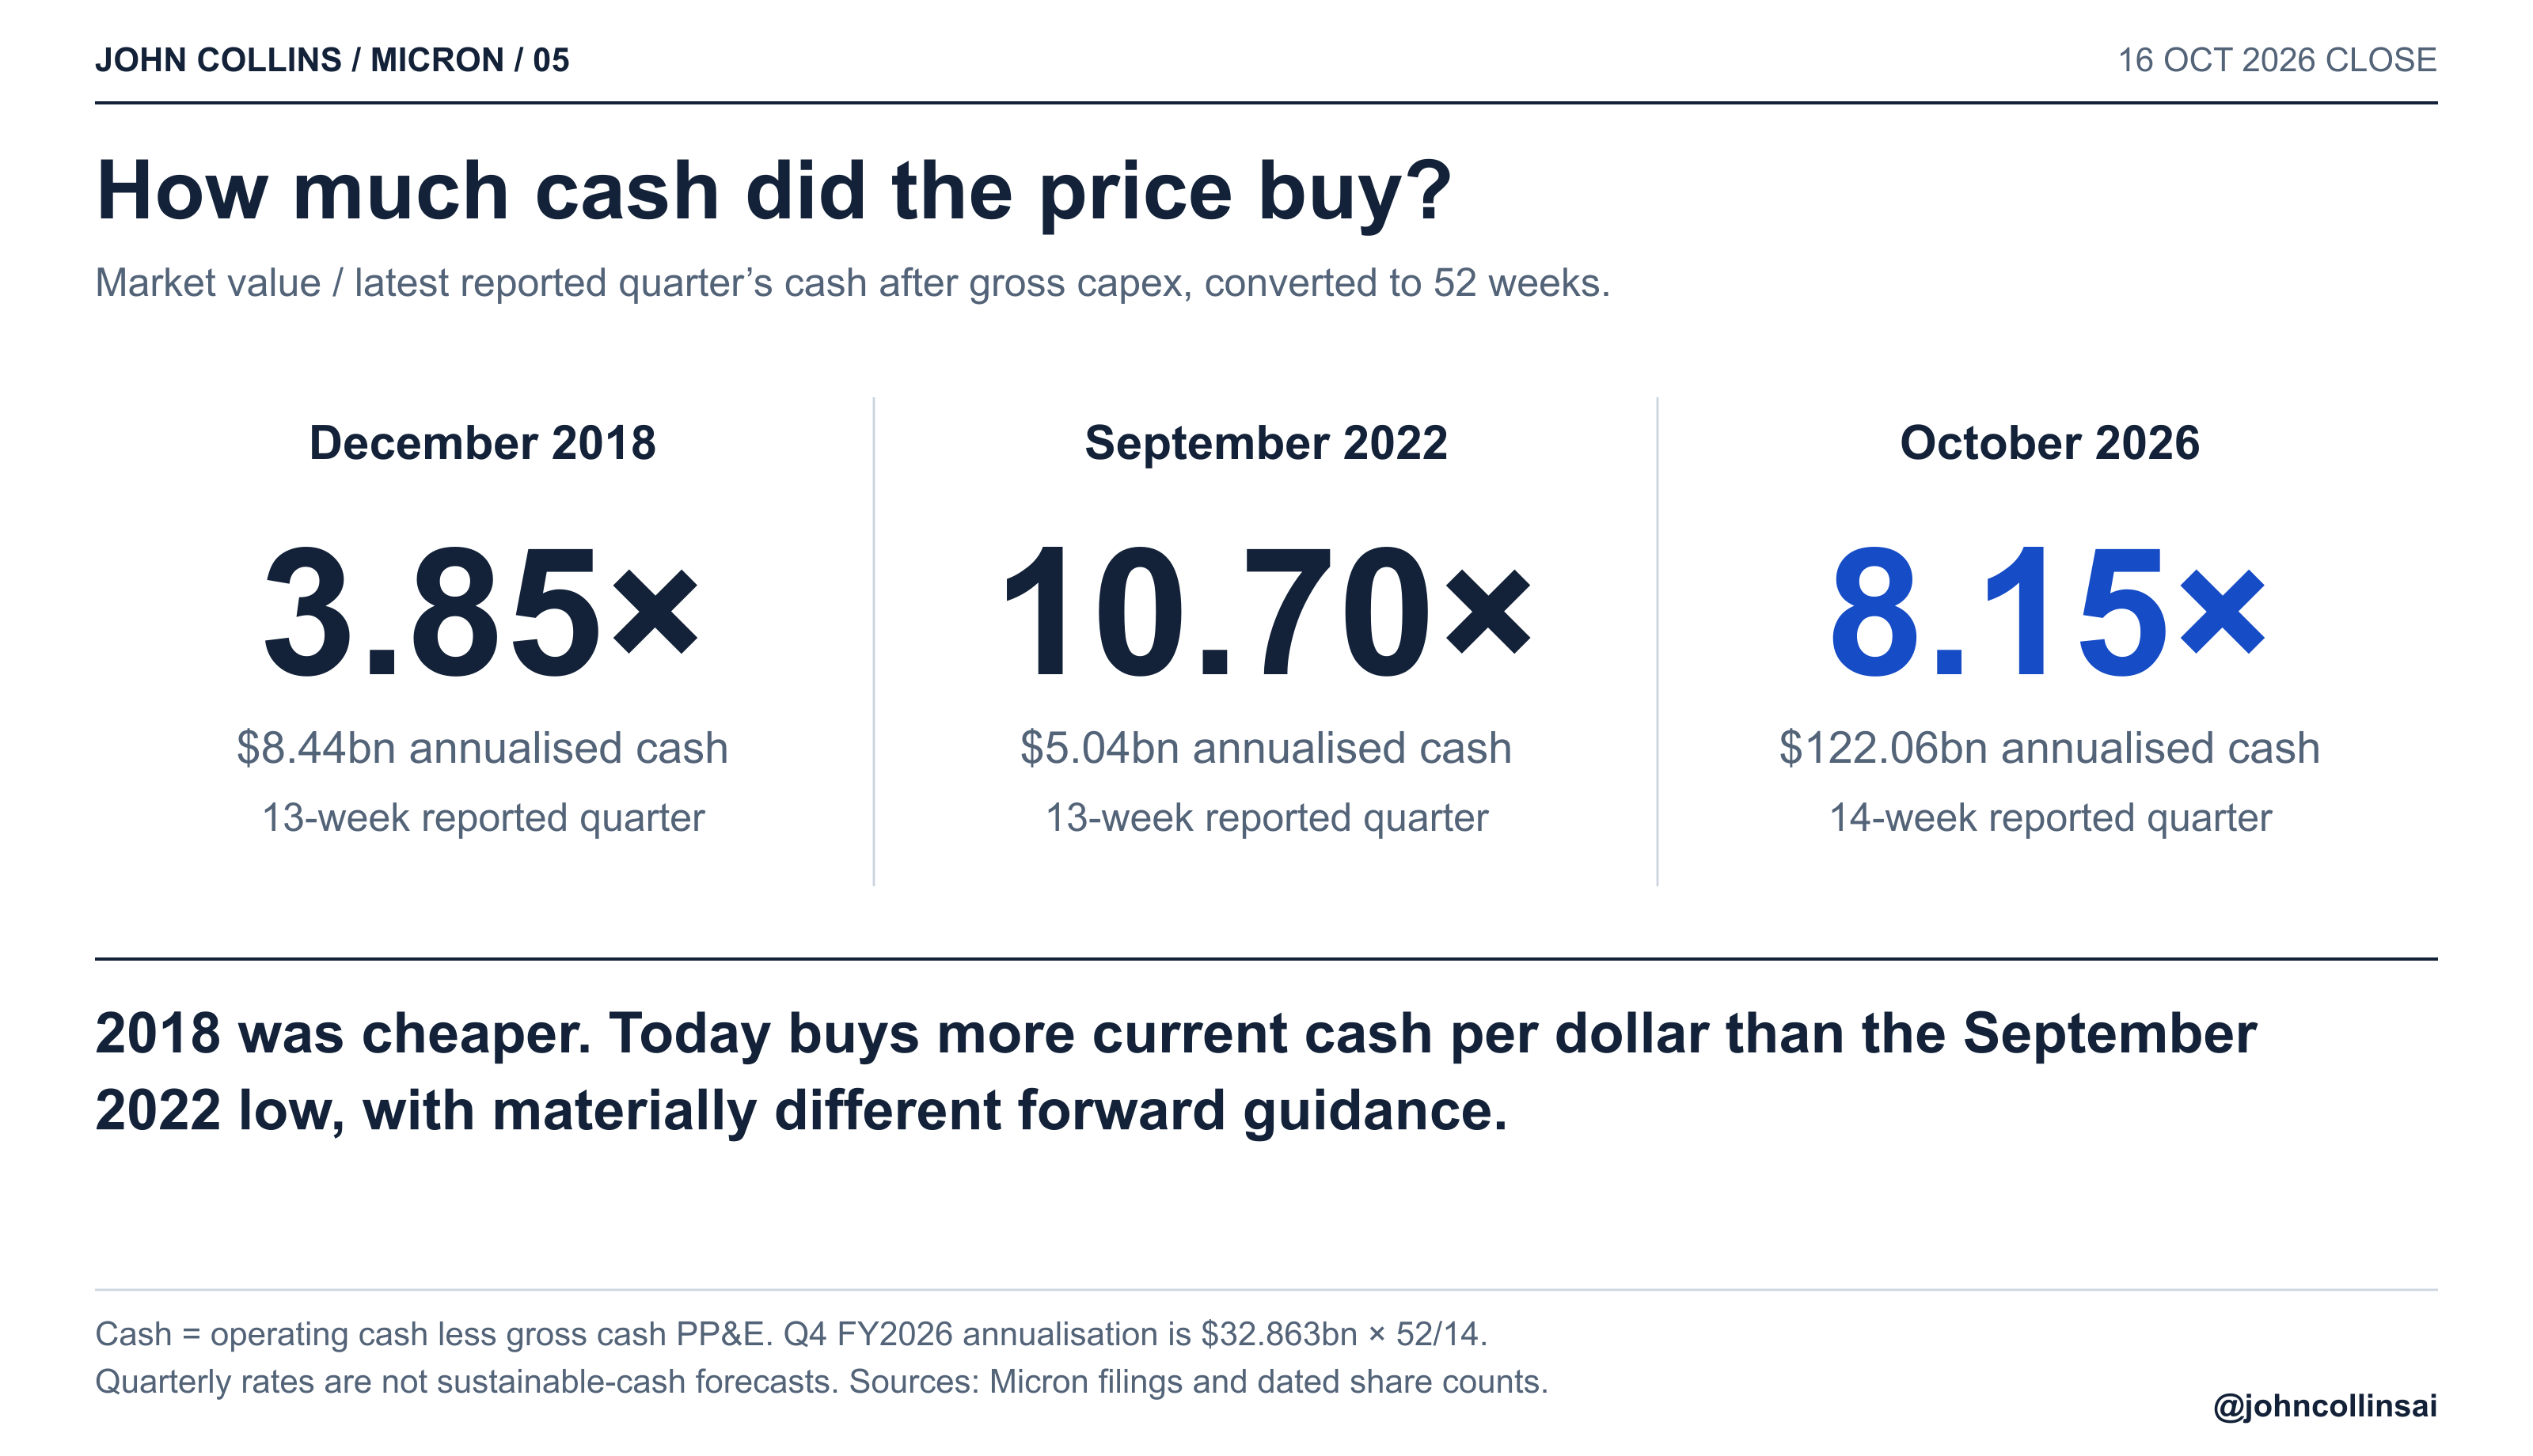
There is another difference. Before the September 2022 low, Micron had already warned of weaker revenue and margins and negative free cash flow in the next quarter. Its last reported quarter was running ahead of the outlook. Current guidance points to higher revenue and adjusted EPS. [6]
None of this licenses freezing capital spending. Management's first-half FY2027 net-capex plan is approximately $25bn, with a higher second half: more than $50bn for the year. Cash collection and reinvestment belong in the same calculation.
At Friday's roughly $994bn equity value, an investor choosing a 10% annual cash-yield hurdle needs about $99bn of recurring cash after capex. A 12% hurdle needs $119bn. Put those requirements beside the $59bn actually generated in FY2026, the latest-quarter equivalent of $122bn, and the $143bn FY2027 consensus.
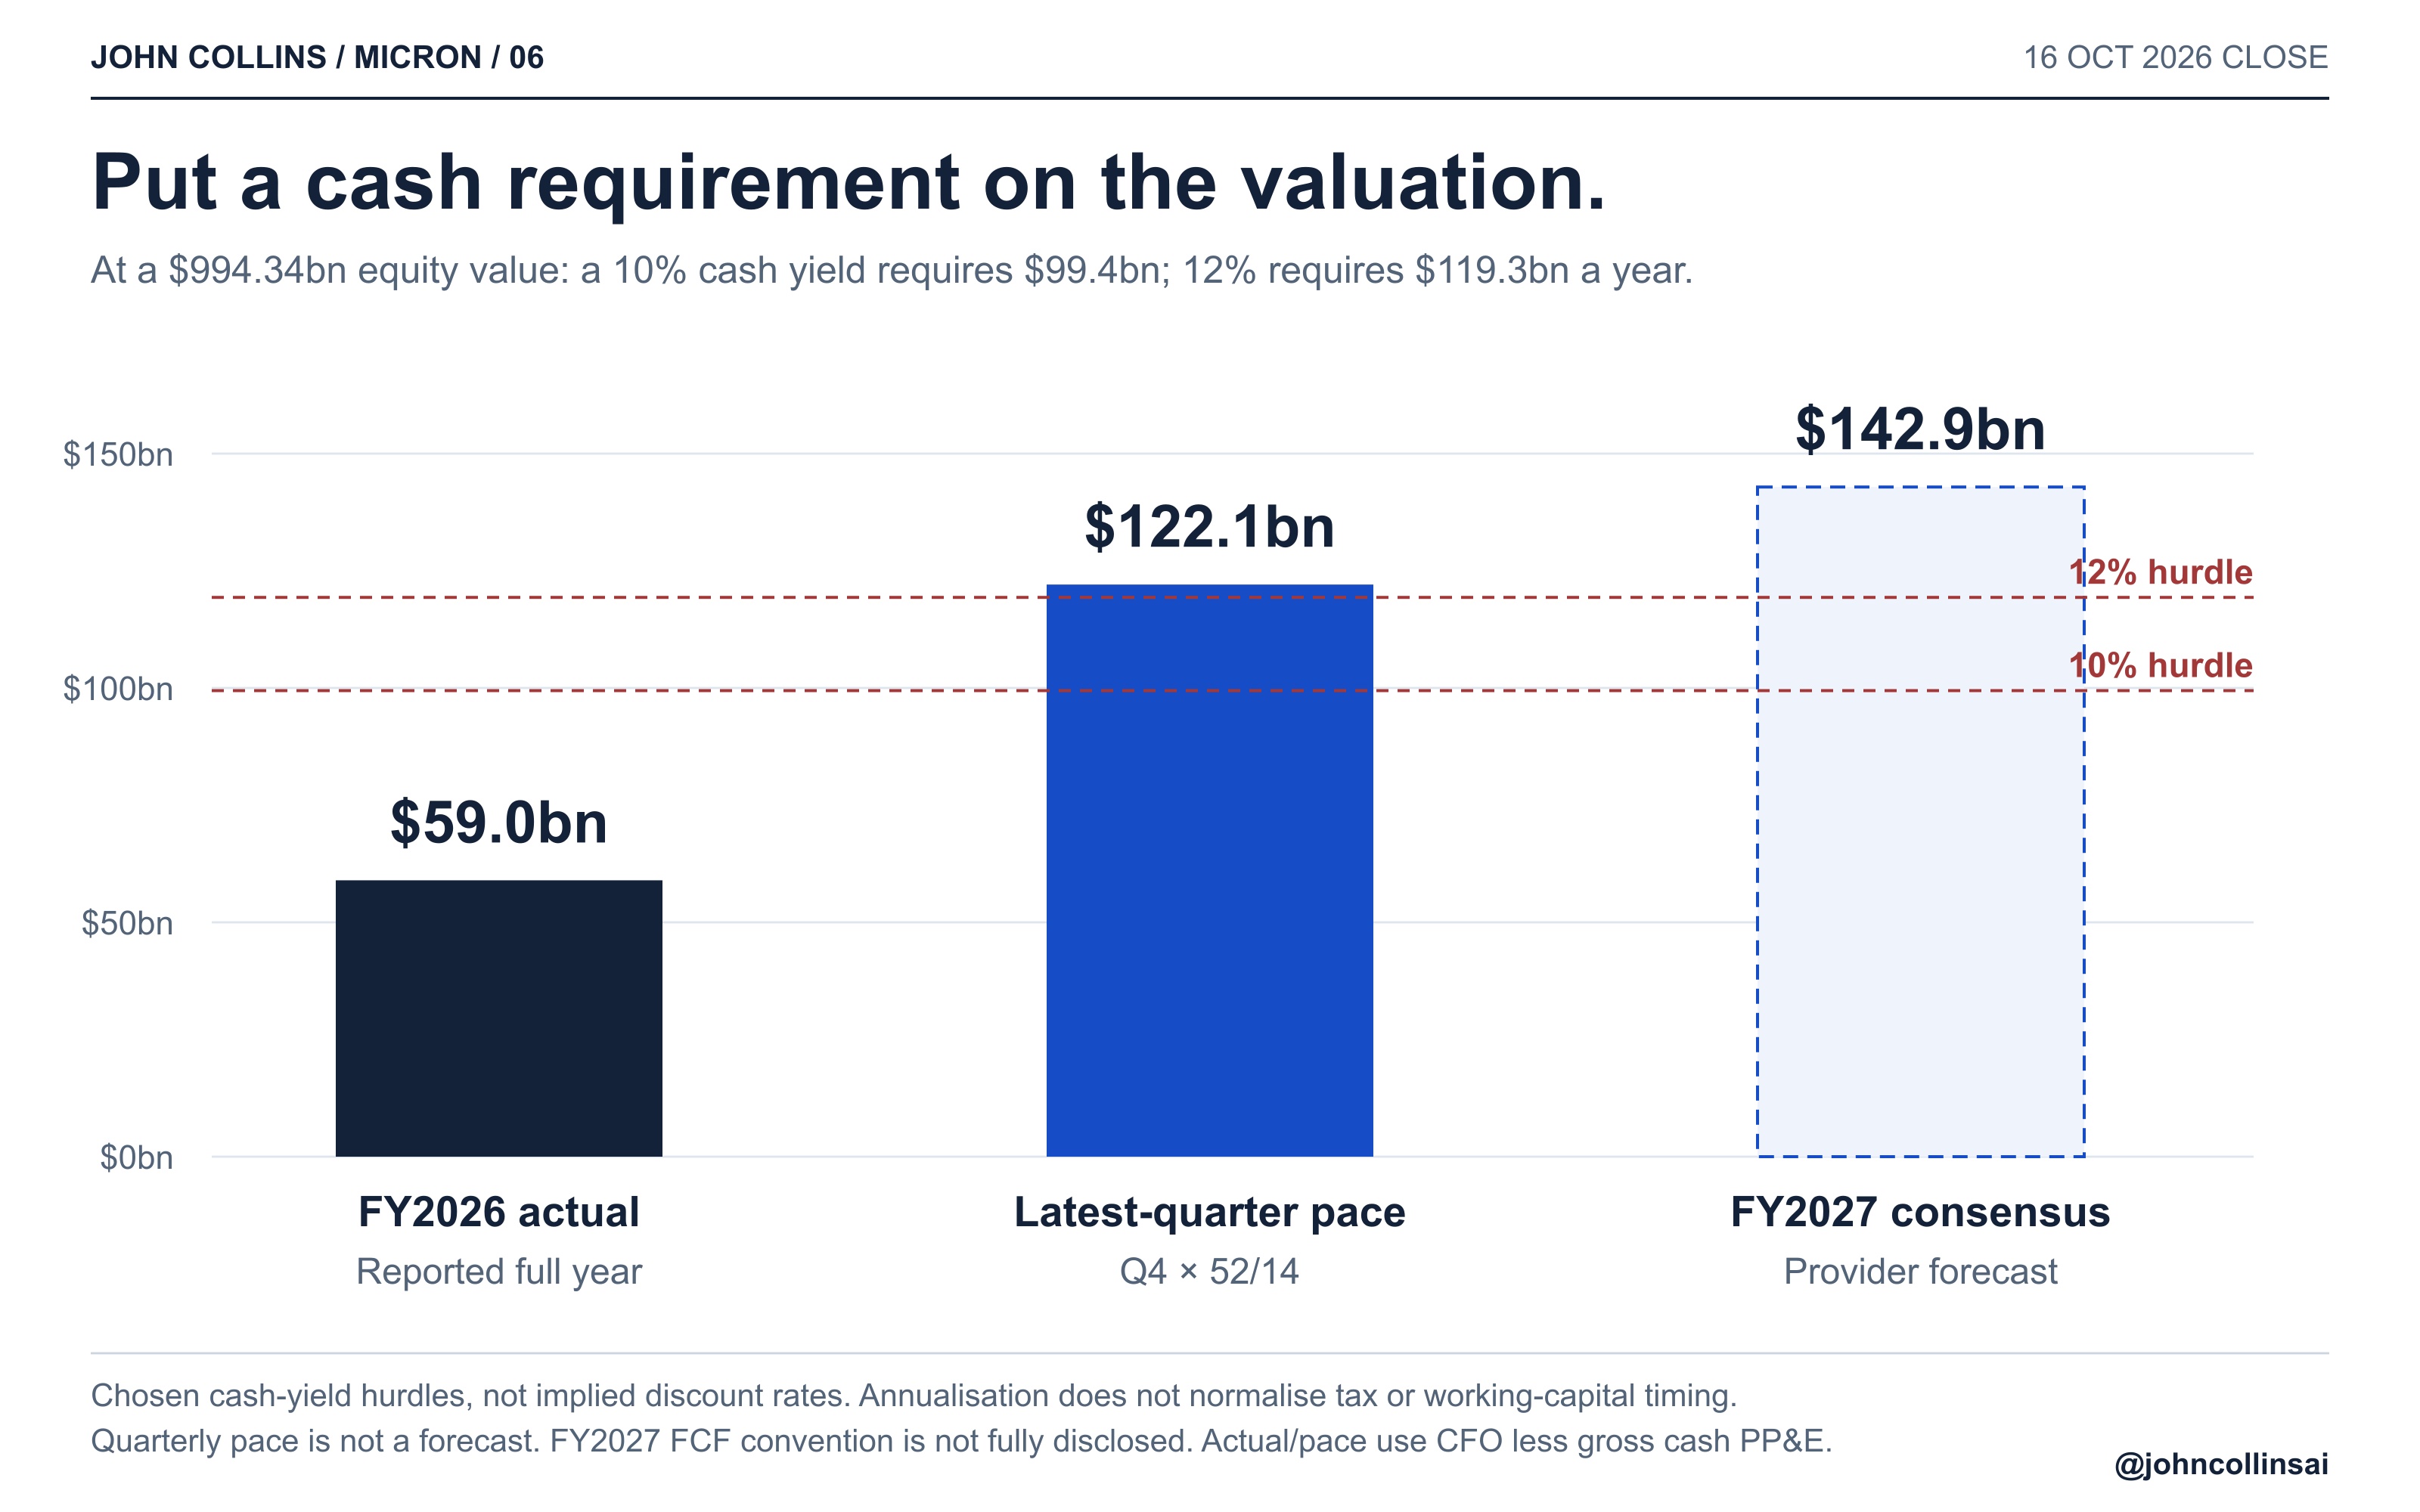
The consensus cash forecast implies a 14.4% yield. It is about 17% above the quarterly equivalent, rather than the 142% increase suggested by comparing it only with the rapidly growing company's trailing year. The provider's forecast FCF convention is not fully disclosed, so the 17% is an approximate bridge, not an accounting reconciliation. [2]
The debate is increasingly about duration.
The broker updates I could verify do not provide a fresh Micron earnings cut to explain Friday's fall. KeyBanc's reported 15 October checks raised memory estimates. Its DRAM pricing forecast was 15–20% quarter on quarter; some derivative reports incorrectly changed that to year on year. Rosenblatt subsequently defended its Buy call. These are attributed reports of notes, not access to the banks' full models. [10] [11]
DA Davidson's reported $3,000 target at 19 times FY2027 earnings is revealing for another reason. That arithmetic implies approximately $158 EPS, below the current $176.55 consensus. One need not endorse the target to see that much of this disagreement is about the multiple and the duration it recognises, rather than demanding still higher near-term earnings. [12]
There are legitimate opposing views. Vltava's October letter questions treating infrastructure suppliers' current profits as normal when customers have yet to recognise the full depreciation of their purchases. That accounting timing is real. It does not, on its own, establish the future pricing, collections or investment returns of Micron's contracted business. The company's own agreements and cash flows are the evidence needed to make the argument specific. [13]
Public discussion alternates between “peak earnings” and bullish claims that turn commitments into collected cash. Neither shortcut helps. Nor does a price decline identify the seller, prove forced liquidation or tell us which earnings assumption changed.
The next tests are concrete: delivery against the $38.15 Q1 adjusted-EPS midpoint; collections and cash after the larger investment programme; further contract disclosures; and execution of the $35.16bn buyback authority available from 9 December, subject to CHIPS funding conditions. That authorisation is roughly 3.5% of current equity value. It is permission to return cash, not cash already returned. [7]
The market has pushed Micron's forward multiple below several documented old trough valuations. Meanwhile, customers are committing years of purchases and pricing terms that support a different earnings profile.
That is the disconnect. A lower price for the earnings, alongside stronger evidence that they can last. If the old cycle discount still produces the right answer, it now needs a much better explanation.
Supporting comparison: other valuation measures.
The argument is specifically about forward earnings and their duration. It does not require claiming that every ratio is at a record low. In December 2018, Micron cost about 3.6 times trailing cash after gross capital spending; today that measure is 16.9 times. Book and sales multiples are also higher. [16]
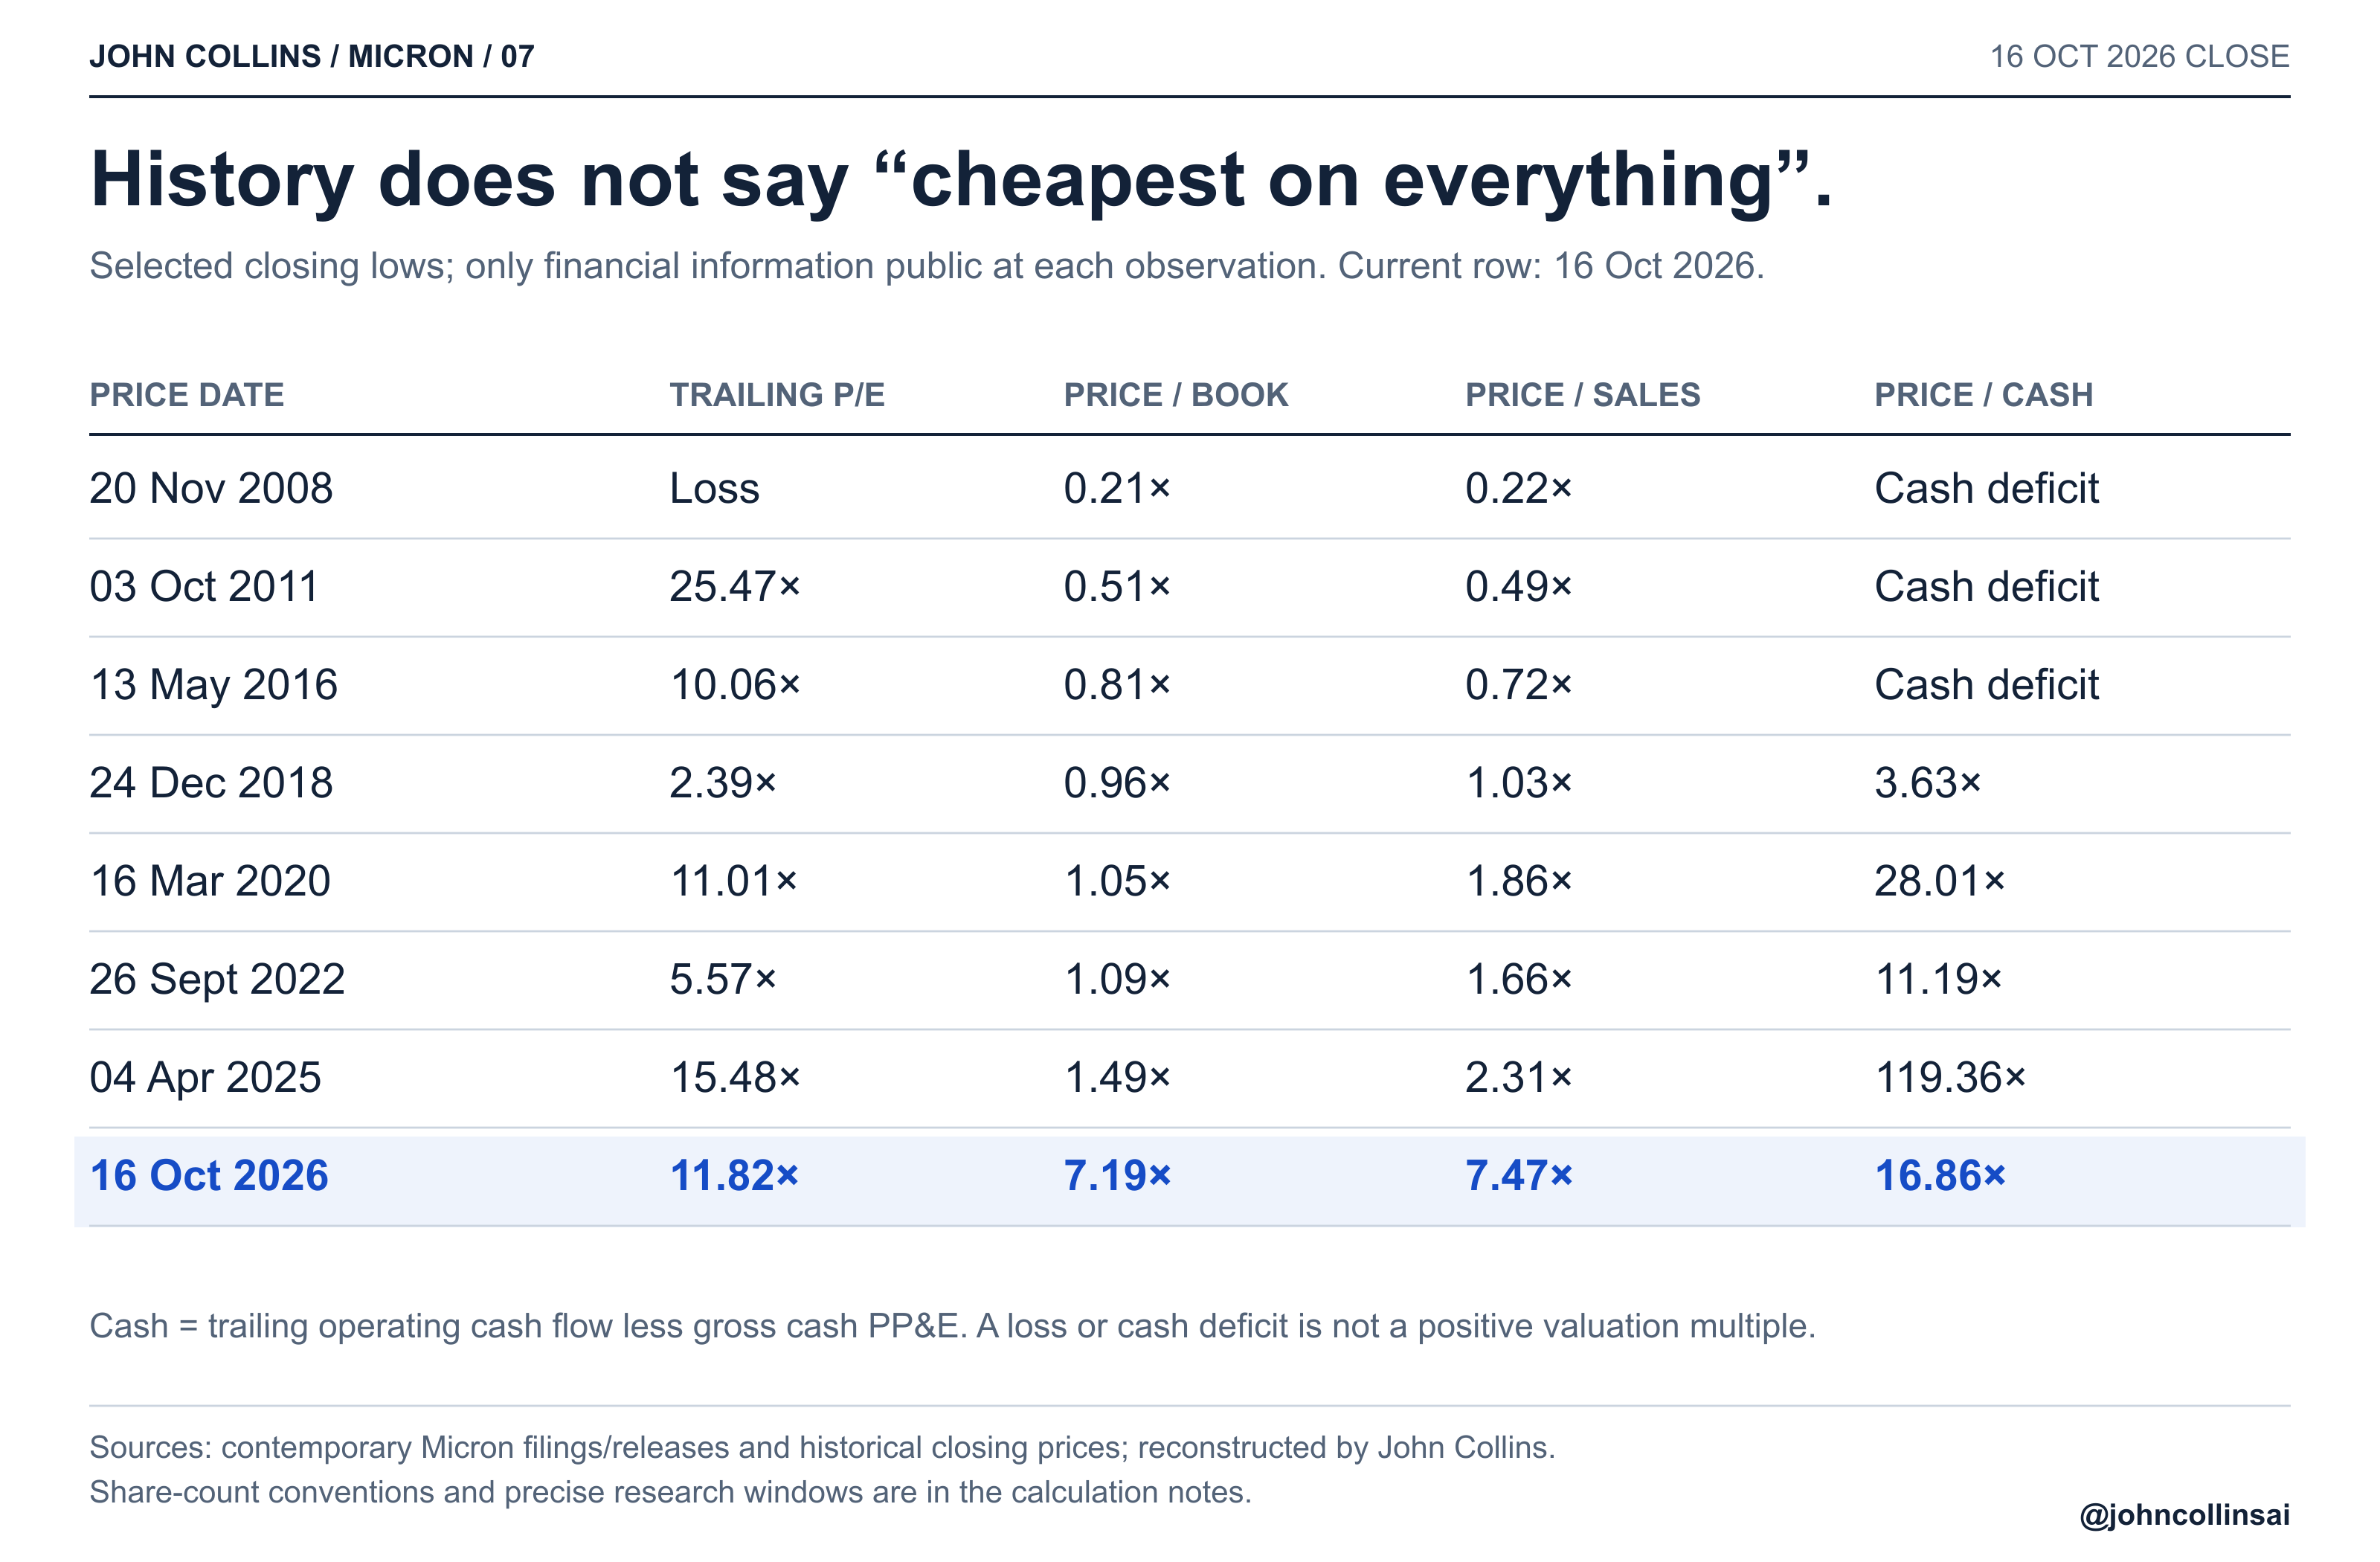
Different profitability means a dollar of sales or book equity can support very different earnings. The current-quarter cash comparison and the reinvestment analysis above help explain what those higher asset multiples buy. The distinctions belong in the calculation; they do not erase the forward-earnings comparison.
Sources and calculation notes
Price anchor: 16 October 2026 regular-session close, $878.84. Forecast snapshot: 15 October. Dollar amounts are USD. No subsequent price is mixed into the ratios.
- Micron: FY2026 and Q4 results. Reported cash, earnings and guidance; gross-capex calculations use the cash-flow tables, rather than issuer adjusted FCF.
- S&P Global consensus via StockAnalysis. Explicit fiscal-year adjusted EPS and cash forecasts. Ratios recomputed from $878.84; inconsistent/stale ratio widgets not used.
- Micron post-earnings discussion and prior 10-Q. Process specialisation, construction/equipment timing and the 14-week Q4 convention.
- Brian Gilmartin, 29 December 2018, including dated I/B/E/S consensus. FY2019 EPS $10.61→$7.98; FY2020 $9.83→$7.05. Pair the published estimates with the 28 December $31.57 close, not the earlier 24 December low.
- Zacks, 27 September 2022; Zacks, 4 April 2025; S&P Capital IQ, May 2016 report mirror. Different fiscal horizons; 2016 is one analyst, not consensus. No complete vintage-consensus archive for every low since 2008 was obtained.
- Micron's 9 August 2022 update. Dated evidence of the deteriorating outlook before the September price low.
- FY2026 10-K. Contract disclosures, RPO, deposits, capital allocation and business-unit accounts. RPO $134bn is as of 3 September; management's ~$150bn observation is dated 30 September. No explicit $16bn bridge was disclosed.
- NVIDIA GB300 NVL72 specifications. System memory capacities establish physical content, not Micron's allocation, pricing or profit.
- Micron Q4 prepared remarks and presentation. Commercial memory hierarchy, margins, contract coverage and capex outlook.
- Reported KeyBanc checks, 15 October. Pricing percentages retain the reported quarterly denominator.
- TheStreet's 16 October coverage of Rosenblatt/Fundstrat. Commentary is not proof of market causation.
- DA Davidson target report, 7 October. $3,000÷19≈$157.9 EPS is our calculation; target is not adopted as fair value.
- Vltava Fund's October 2026 letter. Primary buy-side perspective; no Micron-specific contract cash model supplied.
- Micron FY2018 10-K. Intel supply agreements, product concentration, order repricing and the historical business perimeter.
- NVIDIA: reducing KV-cache bottlenecks with Dynamo. Technical mechanism and the trade-off between reuse and transfer overhead. No universal physical-memory growth multiplier is assumed.
- Historical financial statements: FY2008; FY2011 release; Q2 FY2016; Q1 FY2019; Q1 FY2020; Q3 FY2022; Q2 FY2025. The included data files reconcile period-end accounts with the actual outstanding share count disclosed before each price observation.
Historical method. Selected lowest daily closing prices in the 2008–09, 2011–12, 2015–16, 2018–19 and 2022–23 windows, with 2020 and April 2025 separately shown. Financial periods were public at each date. Latest disclosed actual outstanding shares are used where recoverable; the 2011 reconstruction is approximate. Annual cash is CFO less gross cash purchases of PP&E. Older minority interests and financing-classified equipment payments limit comparison with cash ultimately distributable to common shareholders. Negative cash is not assigned a positive P/FCF. Contemporary forward forecasts are a separate sample and are not retroactively applied to earlier lows.
Disclaimer. This is independent research and commentary, not personal investment advice. Figures are dated; sources, definitions and calculation assumptions accompany the analysis. Historical valuation comparisons use the forecast periods shown, which are not identical. Annualised quarterly results illustrate a pace, not a full-year forecast. Contracts improve visibility but do not guarantee companywide profits. Analyst targets are cited for context, not adopted as predictions.