

Between 22 June and 29 July, the S&P 500 ETF fell 2%. The semiconductor ETF fell 24.6%. Same dates. Anyone invested in AI infrastructure hardly needs reminding, but it is worth putting the two numbers together before asking how much longer this bull market can last. SPY daily history SMH daily history
Micron lost 39% over that window. CoreWeave 45%. Nebius 48%. These are selected examples, not an AI index. They do rather complicate the idea that investors are all enjoying the same four-year bull market. Micron CoreWeave Nebius
Barron’s makes a constructive case this weekend: roughly $40tn of additional market value, substantially higher earnings, and a market that need not expire because it has reached its fourth birthday. I agree with that last point. What interests me is how much can happen underneath the index while the birthday count continues. Barron’s, 11 October
By Friday, SMH had recovered almost 20% from its July low. It was still nearly 10% below its June high. The index can make a new record while an investor in the infrastructure enabling its growth is still getting back to where they started. SMH daily history
That is the starting point for a more useful sustainability question. How much earning power is being created, who retains it, and how much of it does the share price already require?
The cash case is considerably stronger than the bubble shorthand suggests.
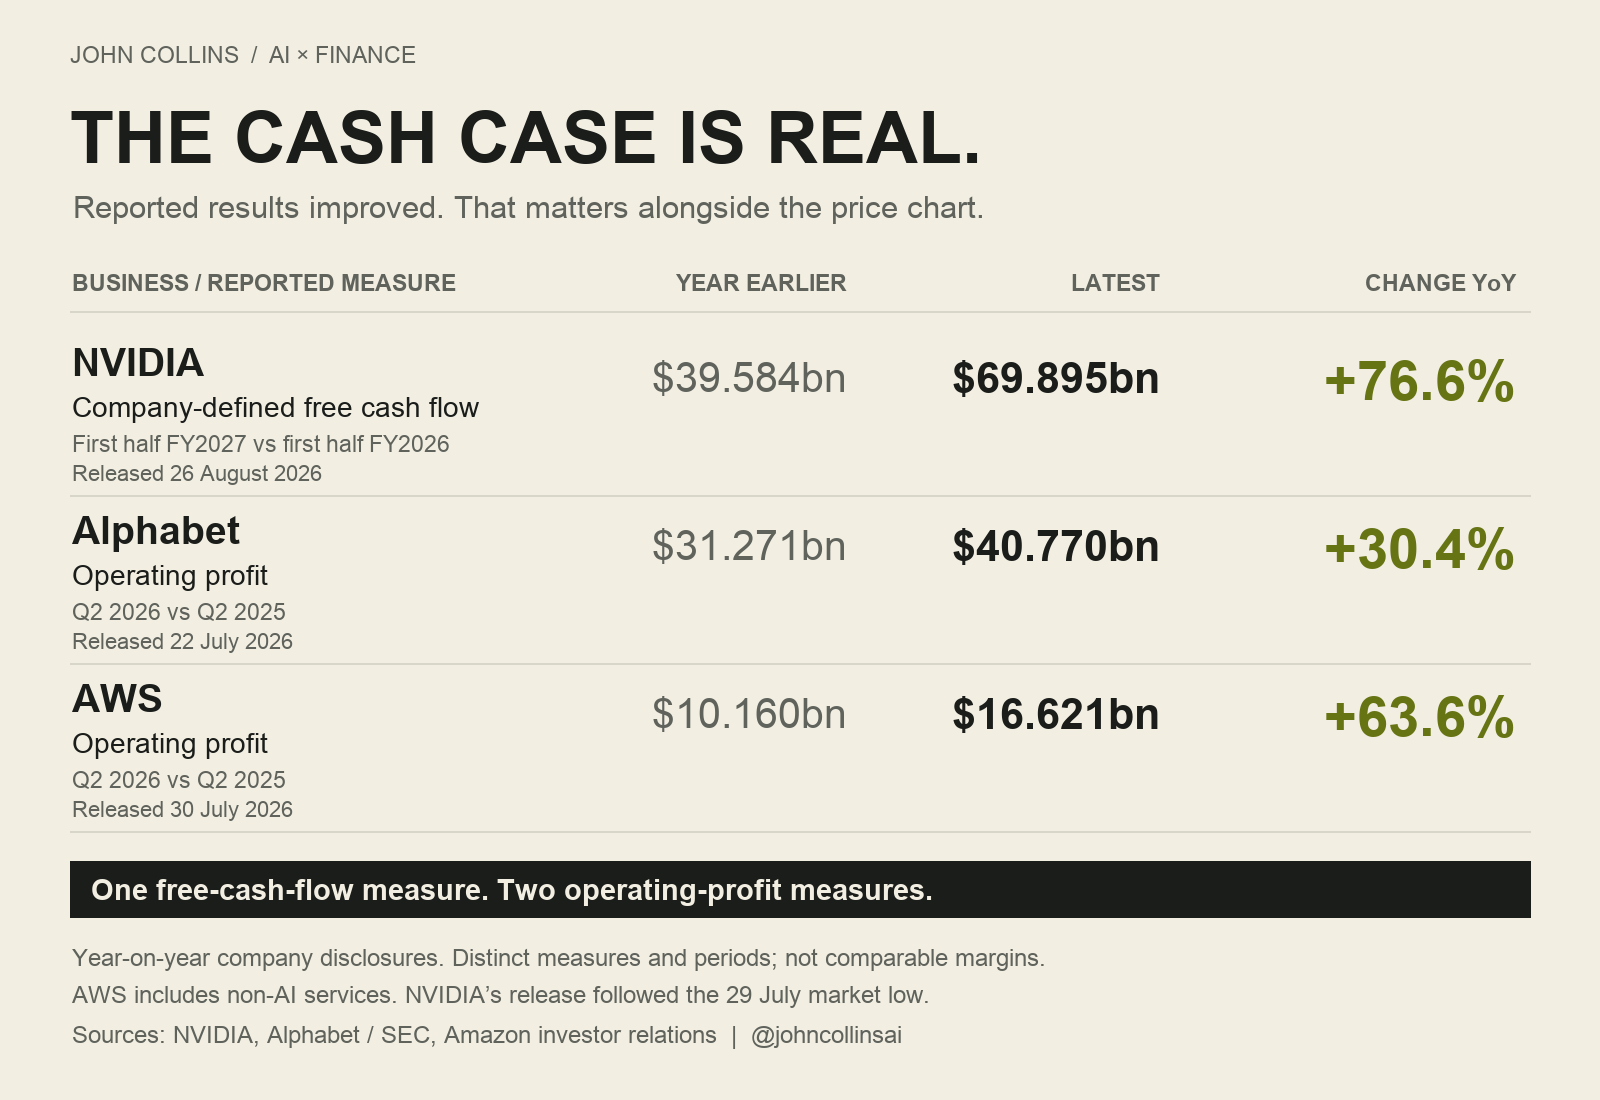
NVIDIA’s subsequent accounts showed $69.9bn of free cash flow in the first half of its financial year, up 76.6%. Those results were released in August; they were not information available at the July trough. Alphabet’s second-quarter operating profit rose 30.4%. AWS’s rose 63.6%. AWS includes plenty of non-AI business, and operating profit is not free cash flow. Even after making those distinctions, large businesses are actually earning substantially more money. NVIDIA, 26 August Alphabet, 22 July Amazon, 30 July
The forecasts have improved too. Comparing FactSet’s July and October reports, forecast S&P 500 earnings for the same 2027 calendar year rose from $398.32 to $420.59, about 5.6%. The 2026 figure rose 6.7%, although that now blends reported results with forecasts. This is more informative than simply observing that next-12-month earnings have increased: that rolling number also advances into a later, higher-earnings period. The 2027 upgrade shows that expectations genuinely moved higher even when we hold the year fixed. FactSet, 2 July, p.31 FactSet, 9 October, p.33
At 19.1 times forecast earnings on 8 October, the index was around FactSet’s ten-year average. That is hardly evidence that investors are paying ever more for every dollar of expected profit. But the dollar in that sentence is still a forecast dollar. A lower multiple does not audit it for us. FactSet, 9 October
There is a particularly interesting example of what can sustain the earnings in Microsoft’s July call. Management said additional Azure capacity brought online during the quarter was quickly monetised. It also reported a fourfold improvement in throughput for Copilot workloads since the start of the year. GitHub Copilot margins improved through the quarter following the move to usage-based pricing. Microsoft, 29 July call
Three different things are happening there: capacity comes online sooner, more work gets through it, and the customer’s bill better reflects the work consumed. That is a rather more useful explanation of how the build-out can pay than another discussion of how many GPUs have been ordered.
It also challenges a surprisingly restrictive assumption: that AI must finish building before it can start earning properly. Existing capacity can become more productive while new capacity serves additional demand. Better economics can fund more construction. A company choosing to reinvest those proceeds may report less free cash flow today than one that stops expanding. The lower number alone does not tell us which decision creates more value.
Nor should we assume that the economic opportunity stands still while the machines improve. The Fed’s July research on technological overinvestment allows new investment to improve the productivity of older capital too. But firms are discovering the size of an initially unknown, fixed technological advance. That does not settle the case of a frontier that keeps moving as models, inference systems and applications improve. If more work becomes worth delegating, the investment opportunity changes too. We still have to demonstrate the paid demand; we should not quietly assume it away. Federal Reserve research note, 6 July
There is a serious countercase, but it needs to be stated properly.
A supplier can collect cash for equipment while its customer capitalises the purchase and recognises depreciation over several years. The supplier’s profit is real. The buyer’s eventual return is a separate calculation. Similarly, Alphabet’s substantial operating growth sat alongside roughly $99bn of equity-security gains in the second quarter. Combining those gains with recurring profits and assigning the whole lot the same valuation would be poor analysis. So would subtracting them from a different period’s forward earnings without checking what that forecast already includes. Alphabet’s financial statements
Alphabet also raised $49.6bn through common and mandatory-convertible equity in June, with AI infrastructure among the stated uses. An attractive investment can justify issuing shares. The existing shareholder still needs to know what the expanded business earns per share after those additional claims. Operating growth and entirely self-funded expansion are different propositions. Alphabet’s June capital raise
The financing matters in equally specific ways. A cash-rich supplier, a cloud platform and a leveraged operator building against a customer commitment do not own the same claim on the same future. Their exposure to utilisation, replacement costs, interest rates and dilution differs. Calling all three “AI” is useful for a watchlist. It is much less useful for estimating what can go wrong with the equity.
This is where a broad-market answer can become positively unhelpful. An intact S&P trend tells us little about whether a particular infrastructure company can deliver, collect and reinvest on attractive terms. Equally, its share price falling 40% does not establish that its customers have stopped needing the infrastructure. The price decline has to be connected to evidence about the business. June and July do not identify the sellers, their motives, or the fair value of every company caught in the move.
And what about those reassuring historical comparisons?
The five earlier bull markets overlapping the last 50 years that lasted four years did all reach their fifth birthdays. That leaves plenty of room for this one to continue. It is not a timetable. Between the fourth and fifth anniversaries of the 1982 low, the market gained 36.6%; over the following year it lost 21.0%. The equivalent windows from the 2002 low delivered 15.9%, then lost 41.9%. Other continuations were much longer. The full table is below because selecting only the reassuring years, or only the disasters, rather defeats the point of looking at history. Carson’s original comparison Historical endpoints Daily index history
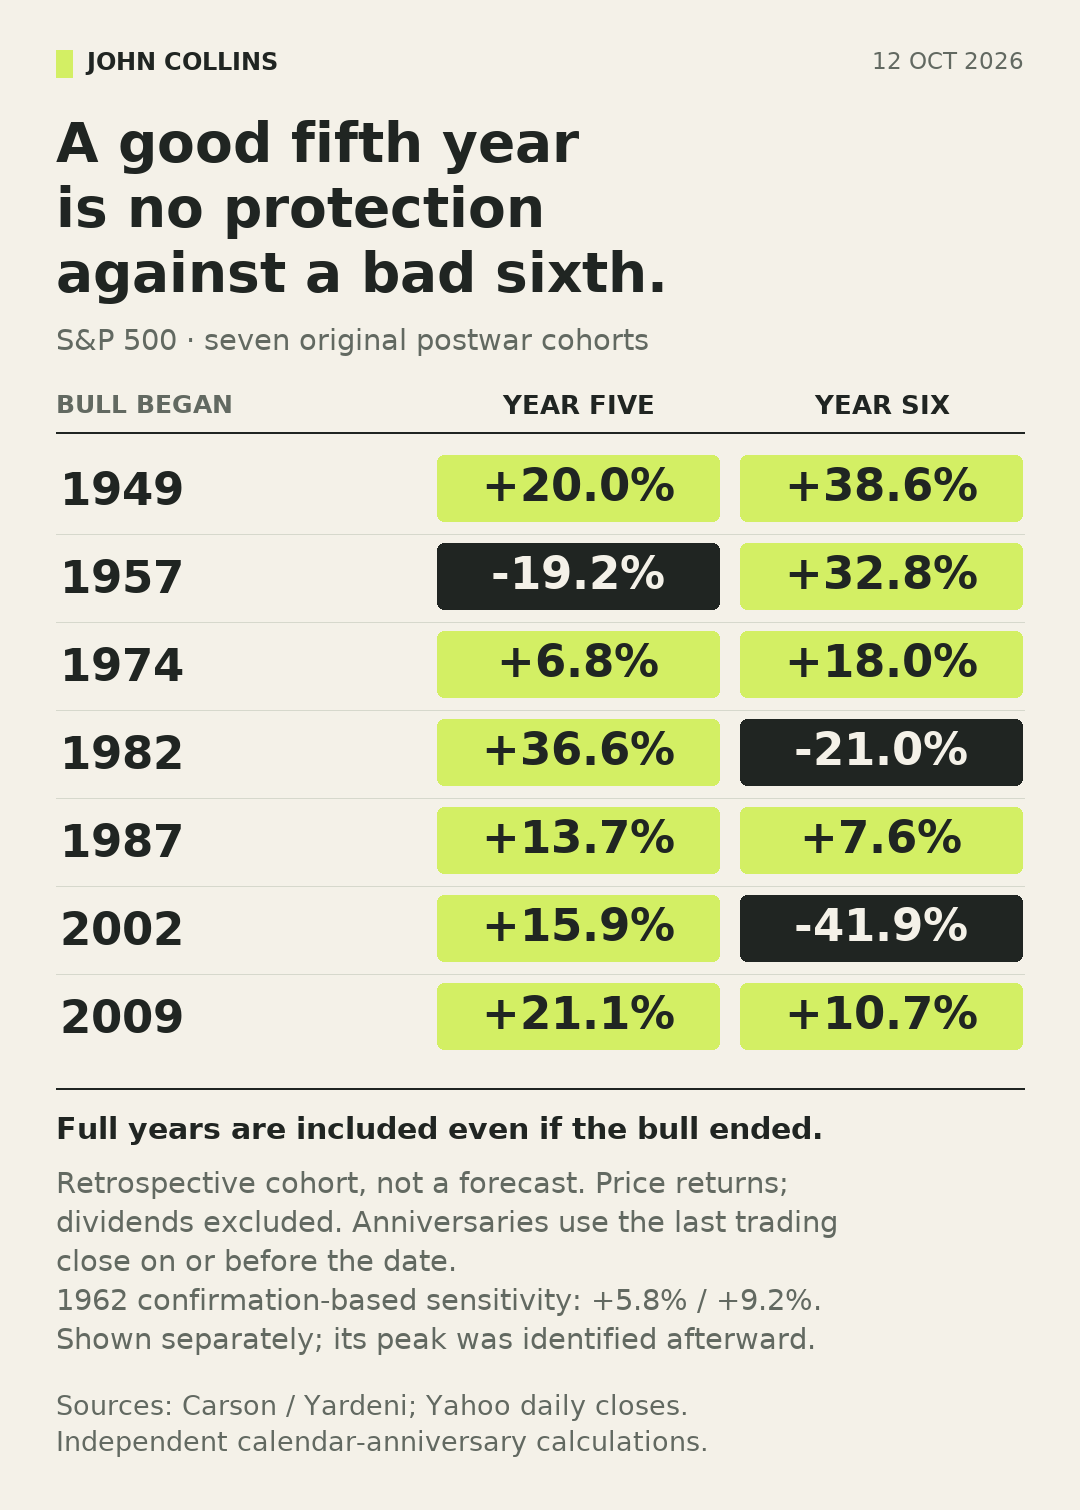
The historical starting valuations differ substantially too. Shiller’s provisional October CAPE is about 40.7, well above those earlier fourth birthdays. It uses a decade of inflation-adjusted earnings, which can lag a structural improvement in profitability. The forward multiple risks the opposite error: accepting an improvement before it has been earned. The disagreement between those denominators is something to investigate, not resolve by automatically preferring the one that supports our prior. Shiller’s original data
My reading is constructive on the economic expansion. There is actual cash generation, improving fixed-year earnings expectations, and a credible engineering and commercial explanation for further growth. Neither the age of the rally nor the size of the build-out overturns that evidence. The arithmetic also leaves room for earnings growth to absorb a lower valuation multiple, as it already has at the index level.
What would change my view is deterioration in the things doing the work: paid usage, collections, returns on additional capacity, and forecasts for the same earnings periods. Funding growth externally is perfectly rational when the additional business earns an attractive return. Repeatedly refinancing losses without improving the economics is a different proposition. The research needs to distinguish them, company by company.
I cannot turn any of this into a reliable number of months before the next structural top. But I would be wary of making the broad index’s next bear market the event on which an AI investment process depends.
For parts of this market, the bear already arrived. The more interesting question is what kept earning through it, what has improved since, and whether today’s price gives that improvement enough credit.
Data note: prices through the US close on 9 October. June–July figures are close-to-close price returns, excluding dividends, calculated from Yahoo Finance daily history. They describe a selected historical window, not a causal study. FactSet comparisons use 1 July and 8 October snapshots of the same calendar-year estimates. NVIDIA’s free cash flow is company-defined; other company measures and periods are identified separately. Historical bull-market boundaries are retrospective conventions, not real-time trading signals.